👋 Hey there! I'm TJ. I write about data products, technology, software, and economics.
I'm a husband and father, living in Singapore, and from the Philippines. I explore data engineering and accounting at Titanium Birch.
On the S&P Credit Rating Upgrade: The Numbers Behind BBB
Ratings agency Standard & Poor’s (S&P) has raised the Philippines sovereign credit rating from BBB- to BBB, making it fully in the ranks of investment-grade sovereign debt. Let’s look through those three B’s and look at the data behind their decision.
CREDIT UPGRADE - Credit rating’s, despite focusing on government-issued debt, include a variety of factors, such as political and economic risks, and are thus used to gauge the overall creditworthiness and economic outlook of a country’s economy. In this photos is Makati City, the central business district of the country. (Photo: chattygd/Flickr, CC BY 2.0)
The Philippines has received yet another credit rating upgrade, from BBB- to BBB, nudging it further into investment-grade territory. What do these letters really mean, though? We can take a look at the data that S&P has provided in support of their decision in this main and supplementary article, to find out more.
Before we look at the data, let’s define sovereign credit ratings. These ratings are regularly provided by ratings agencies (that largest of which are S&P, Fitch, and Moody’s) on sovereign debt or government issued debt, as a measure of the ability of a certain government to repay debt. Because governments ability to pay is dependent on various risks - political risks can cause policy changes, economic risks can cause changes in tax revenue - these ratings are also used to assess the general economic environment in a country.
The numbers that we will look at are all based on S&P reports. Take note that the figures for 2013 are expected figures, and those for 2014 onwards are forecasts developed by S&P.
Economic and Financial Indicators: Full Steam Ahead!
The first category of indicators that S&P uses in its assessment are economic and financial indicators that relate primarily to the internal economy and how it is able to generate and continue generating income and tax revenues.

GDP growth (upper-left) has been at a very impressive 4%-7% after the impact of the US financial crisis faded in 2009, and is expected to stay within 6% up to 2016. GDP per capita growth, which discounts the effect of population growth, is steady, implying that economic growth will continue to keep pace with the population. The same is true for number of employees. The fact that GDP per capita growth is expected to be higher than GDP per employee growth is because of the expanding labor force or demographic transition.
Investment and external demand (exports) (lower-left) have been the key drivers of growth for the Philippines, especially in 2010 when investors fled from the troubled US and Europe markets and into emerging markets. Domestic demand has little impact on economic growth.
Good news! Unemployment and inflation (upper-right) have both been on a downward trend - a very rare and exciting economic phenomenon. This suggests an increase in real wages, so that more people can feel the impact of increased economic growth.
Savings rates (lower-right) are not that impressive, hovering at around 25% and expected to fall further up to 2016. This is mitigated by the fact that more of these loanable funds will be used in productive investment, keeping the level of investment constant in relation to output.
S&P cites the public-private partnership program as one of the factors for boosting infrastructure projects, but identifies low GDP per capita levels and slow employment growth as key rating constraints.
External and Debt Indicators: Paying down the debt
The second category of indicators concerns the economy’s interaction with the world at large - foreign investment, foreign debt, and capital flows between the Philippines and the rest of the world.
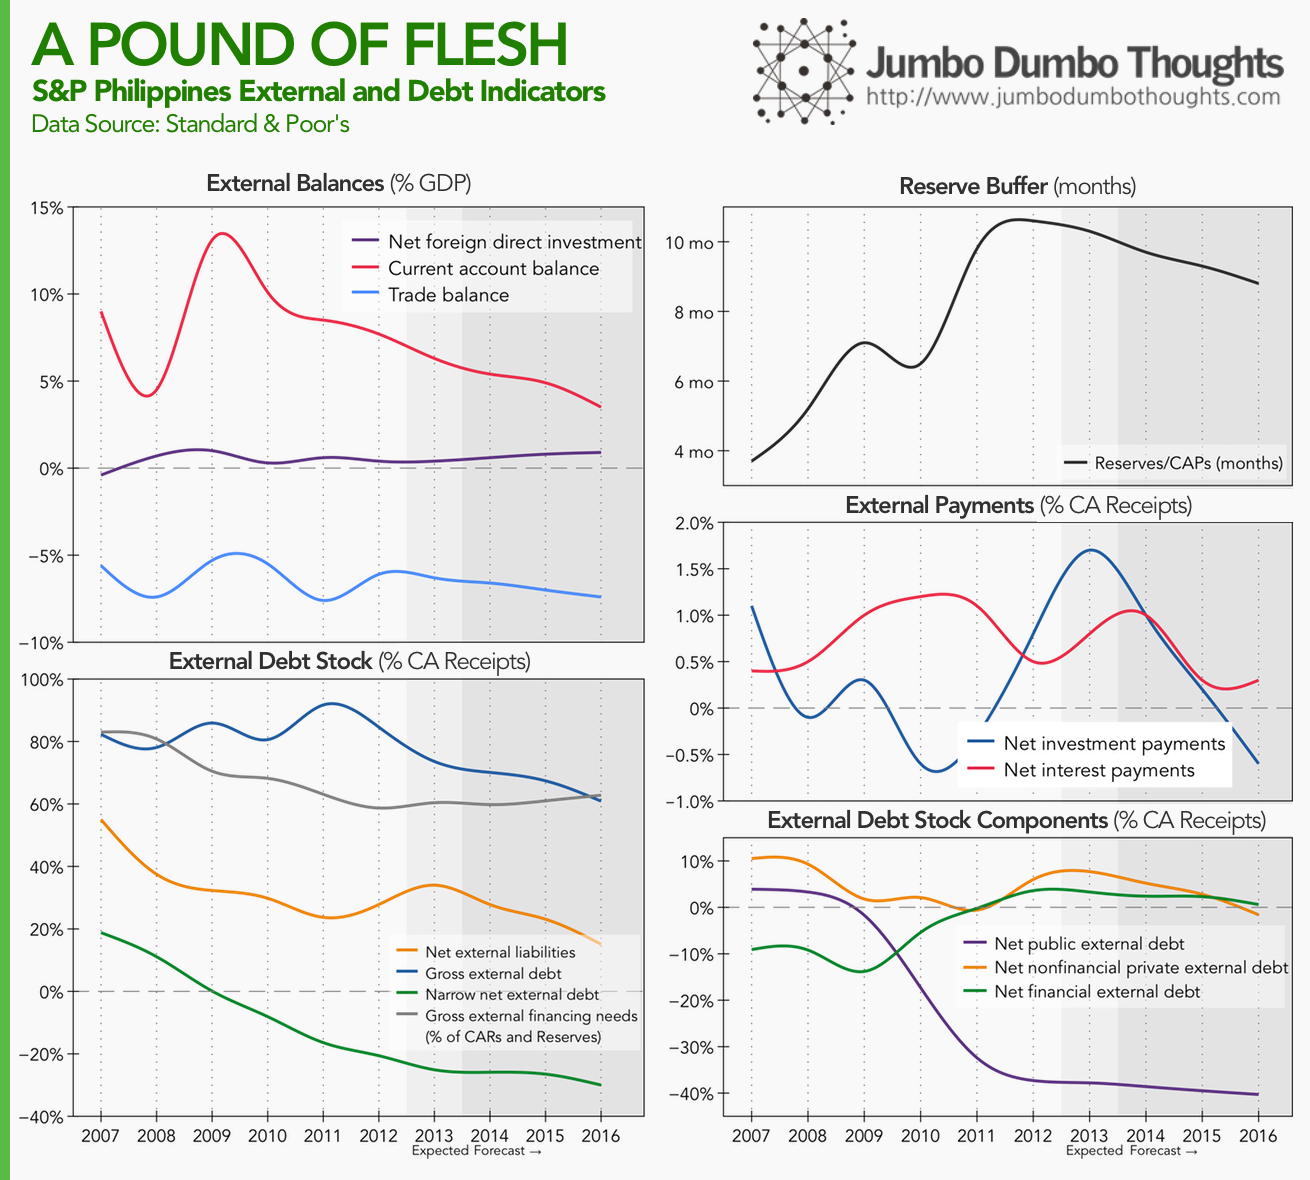
The Philippines' economic performance has caused an improvement in its debt standing. In terms of external balances, current account (upper-left) has stayed at a surplus, meaning that the country is a net lender to the rest of the world. This is because of large OFW remittances, evidenced by the large variance between foreign investment and the current account surplus. The current account surplus is expected to diminish in the future.
In terms of external debt stock (lower-left), all broad and narrow measures of debt are falling. Furthermore, narrow net external debt at a negative level means that we are less vulnerable to shocks if investors decide to pull their funds out of the country since it’s now a net external lender. However, gross external financing needs are still high at 60% to 80%, probably because of reliance on OFW remittances, and more recently the BPO sector. S&P doesn’t expect these inflows to stop anytime soon, however.
The reserve buffer (upper-right) is high; the country can last 9 to 10 months if funds continuously flow out of the country, without any receipts. In 2015, we can expect to be a foreign investor country ourselves, with net investment payments (middle-right) below zero. Net interest payments are also expected to fall.
If we look at who is contributing to the decrease in the country’s debt (lower-right), it’s amazingly the government (public external debt) that’s getting its foreign debt standing together and thus releasing loanable funds for investment in the private sector.
Fiscal Indicators: Prudent Government
The third category of indicators exhibited by S&P relates to fiscal standing, or how well the government is handling its finances (from a strictly inflow-outflow perspective, where those funds come from, and go, is a different question entirely).
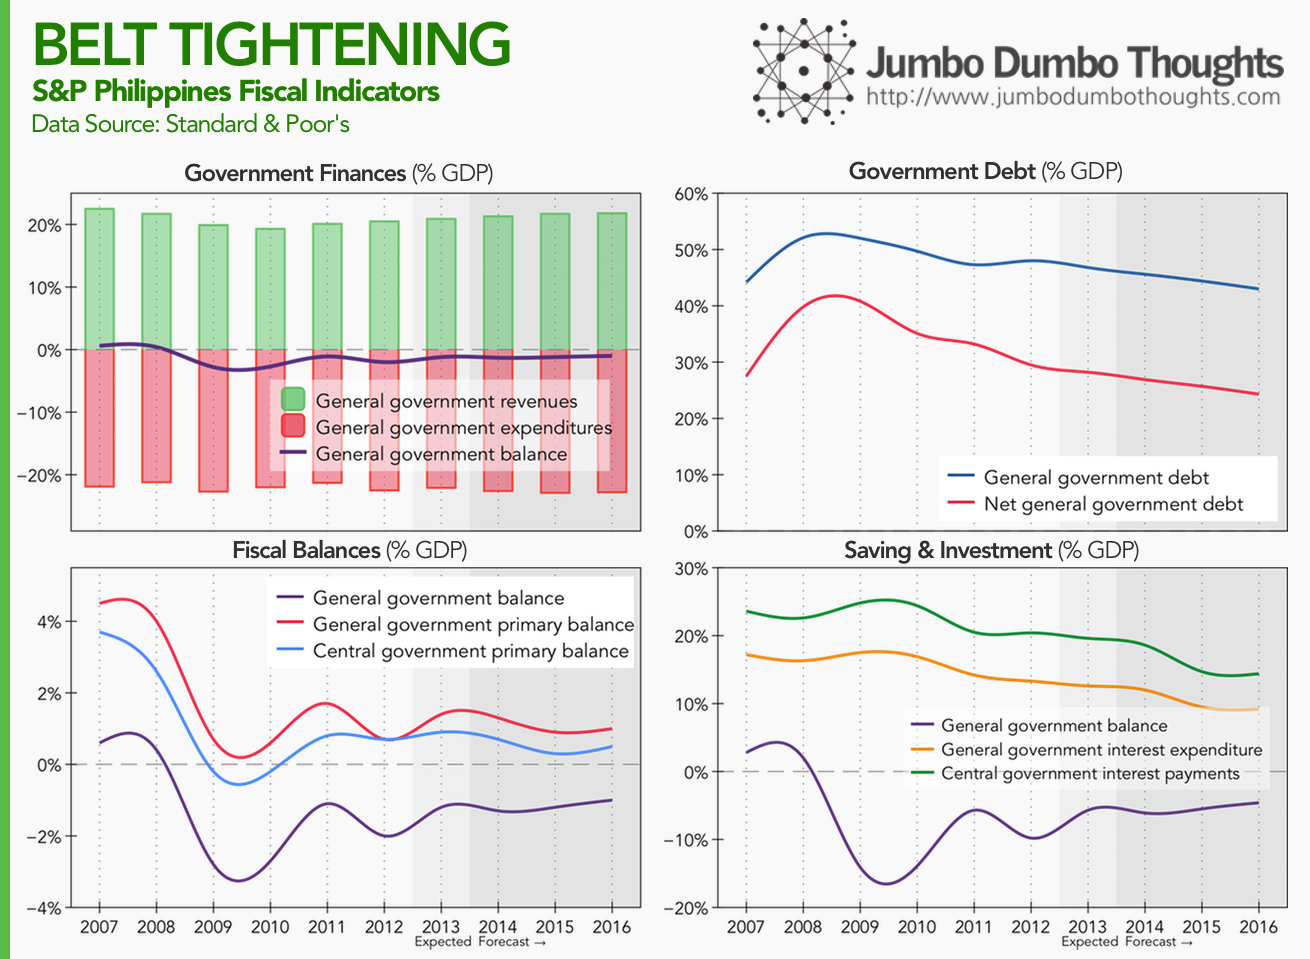
Government has been able to stay at a slight deficit (upper-left), managing its revenues and expenditures quite well. Furthermore, if we remove the impact of interest payments on preexisting government debt (the resulting measure is known as the government primary balance), the figures (lower-left) for both general government (which includes LGUs and GOCCs) and central government are on the positive, meaning that government can support its operations with current receipts and continue paying down debt and subsequently incurring lower interest expense, which is seen in the upper-right panel and the lower-right panel, respectively. However, S&P cites lack of infrastructure and efficient government programs as constraints.
Other Considerations
S&P also assesses monetary policy by the central bank, cites low domestic debt levels, well-anchored and credible monetary policy, and low inflation, as risk-reducing factors, but also notes that high-risk lending to a potentially overheating property sector and underdeveloped capital markets that limit monetary policy transmission as risks.
That’s the data behind the BBB rating. Hopefully, you can now see where specifically the Philippines has improved, has faltered, and has jogged in place. Hope you enjoyed reading!
Thanks for reading! If you found this post interesting, I’d really appreciate a share on your social networks or a comment with your thoughts. Data is taken from the S&P supplementary article.
aliases:
  - 2014/06/on-sp-credit-rating-upgrade.html
  - content/blog/2014-06-01-on-sp-credit-rating-upgrade/on-sp-credit-rating-upgrade.html
  - posts/2014-06-01-on-sp-credit-rating-upgrade
  - articles/on-sp-credit-rating-upgrade
On Purchasing Power Parities, the Big Mac Index, and the International Comparison Programme
The GDP per capita of the Philippines exceeds that of India by 55%, but the cost of living is so much cheaper in India that if you account for cheaper goods and services, that difference narrows to only 20%. In this first installment of Numbersense, we will take a look at purchasing power parities and why they are important for cross-country comparisons.
It’s easy to compare commonly-available figures such as GDP per capita to gauge a country’s wealth, but differences in cost of living means such comparisons leave much to be desired. (Photo: Nina Matthews/Flickr, CC BY 2.0)
This is the first in a series of posts about ‘numbersense,’ or making sure that data analysis and visualization is in consonance with what the underlying data represents.
On the Filipino Migration and Remittances: The grass is still greener on the other side
The Filipino diaspora has been a relatively well-documented phenomenon, as poor circumstances in the domestic economy nudge others to seek greener pastures abroad. But where exactly do these people go, and how have the trends changed since 1990? Also, are there any people coming in to the country? Let’s take a look at the data.
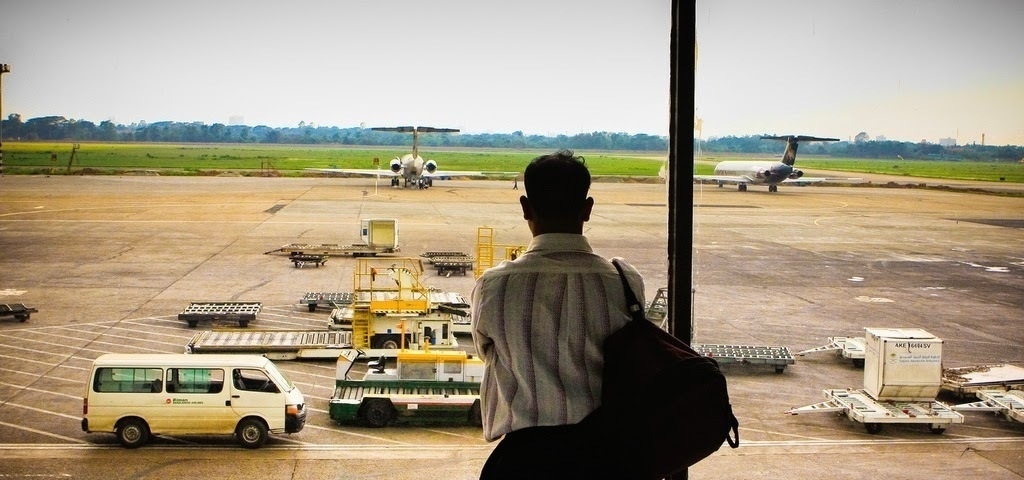
LEAVING ON A JET PLANE. Where do these Filipino migrants go, and which nationalities migrate into the Philippines? In this photo, a migrant worker from Bangladesh, a country which faces similar economic circumstances as the Philippines, awaits his flight. (Photo: Faisal Akram/Flickr, CC BY-SA 2.0)
Economic circumstances and an oversupply of labor in the domestic market have caused what some people have called the Filipino diaspora - a large outflow of migrant workers and overseas contract workers seeking better jobs - and pay - abroad.
On Inflation and Poverty: It's getting more expensive to be poor
On What It Means to Be Filipino

Culture has always been tricky to measure, but by asking the right questions we can get a grasp of how Filipinos think. In this photo, hot ai’r balloons fly at the 16th International Hot Air Balloon Fiesta in Subic, Philippines. (Photo: Lady May Pamintuan/Flickr, CC BY-ND 2.0)
What’s important in life? What do you want in a job? Is suicide justifiable? Would you want a drug addict as a neighbor? How many children would you like to have? Do you have confidence in the church? Find out how Filipinos responded to these types of questions using data from the World Values Survey.
On Delays and Dropouts: A Data Primer on Education

A data-driven look at education reveals large and increasing disparities between regions and gender in terms of enrollment, and also a bleak compensation package for teachers. (Photo: Sean MacEntee/Flickr, CC BY 2.0)
How does the Philippine education system look like through numbers? With new data from the Department of Education posted on the wonderful data.gov.ph, we can generate some interesting snapshots that allow us to assess how the country is doing at teaching future generations.
On Fraud and Fake Ballots: Detecting election fraud through data
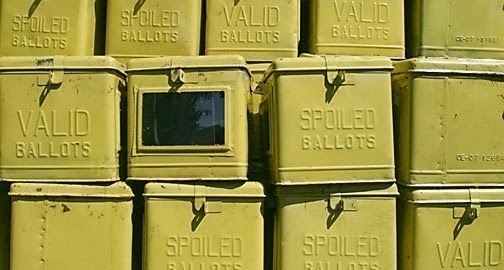
BALLOT BOXES - Data can be used to safeguard ballot integrity, especially in a time of electronic transmission and canvassing of voting information. In this photo, ballot boxes are prepared for use in the 2007 Davao barangay elections. (Photo: Keith Bacongco/Flickr, CC BY 2.0)
Election fraud in the Philippines is almost always alleged, but never really proven. We can explore an approach that can identify voting data patterns those most likely to be associated with vote padding - adding fake ballots - and find out how the sanctity of the ballot can be preserved by the thoughtful use of election data.