Information and links may be outdated.
On Coverage and Capacity: A look at school capacity in the Philippines (EduData Part 2)
Students require rooms, students, and operating budgets in order to receive a proper education. The question is, which resources are in short supply? How does this differ across different parts of the country? Let’s find out how the school system is holding up in this second installment of the EduData Series.
Capacity Capers
Let’s first take a look at some overall capacity metrics:
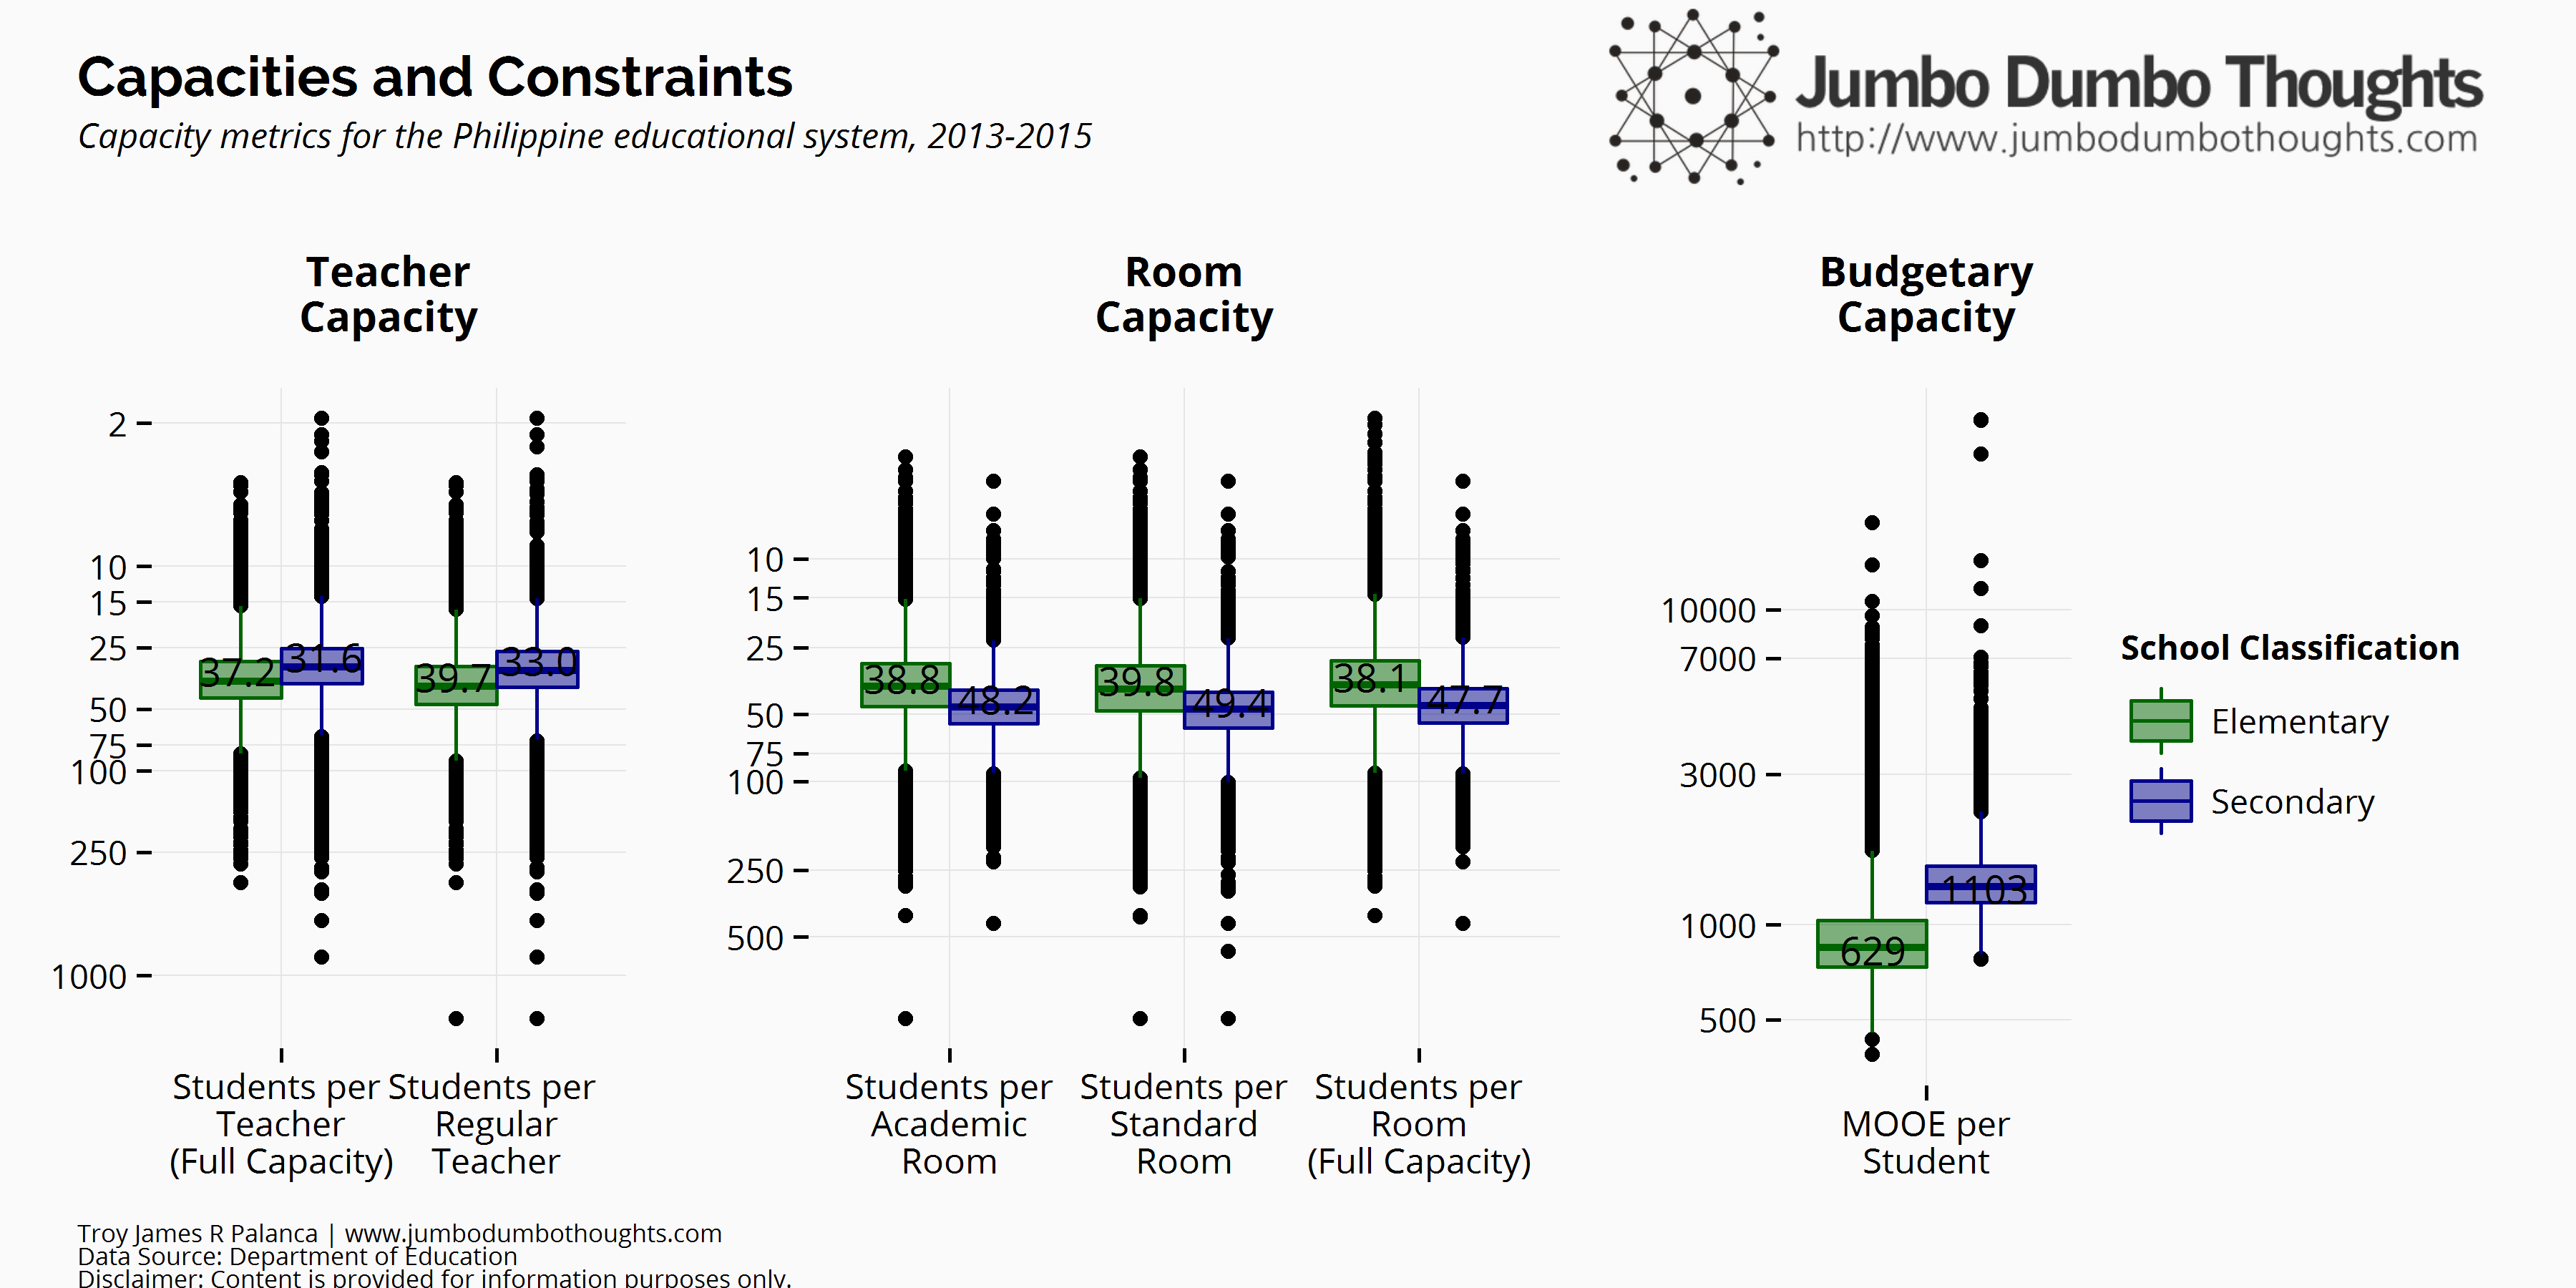
Resources required in an educational system consist of (a) teachers, (b) rooms, and (c) budgets. Teacher capacity averages roughly 35 students per teacher, and rooms slightly worse at roughly 40 students per teacher. Teacher capacity is higher but room capacity is lower in secondary school than in elementary school. However, there are still striking disparities in capacity, with some schools reaching 250 students per teacher or room.
Coverage
While there might be resources placed into the system, the positioning of those resources matters, too. We’ll take a look at the “path of least resistance” of each Philippine city or municipality from the nearest elementary or secondary school.
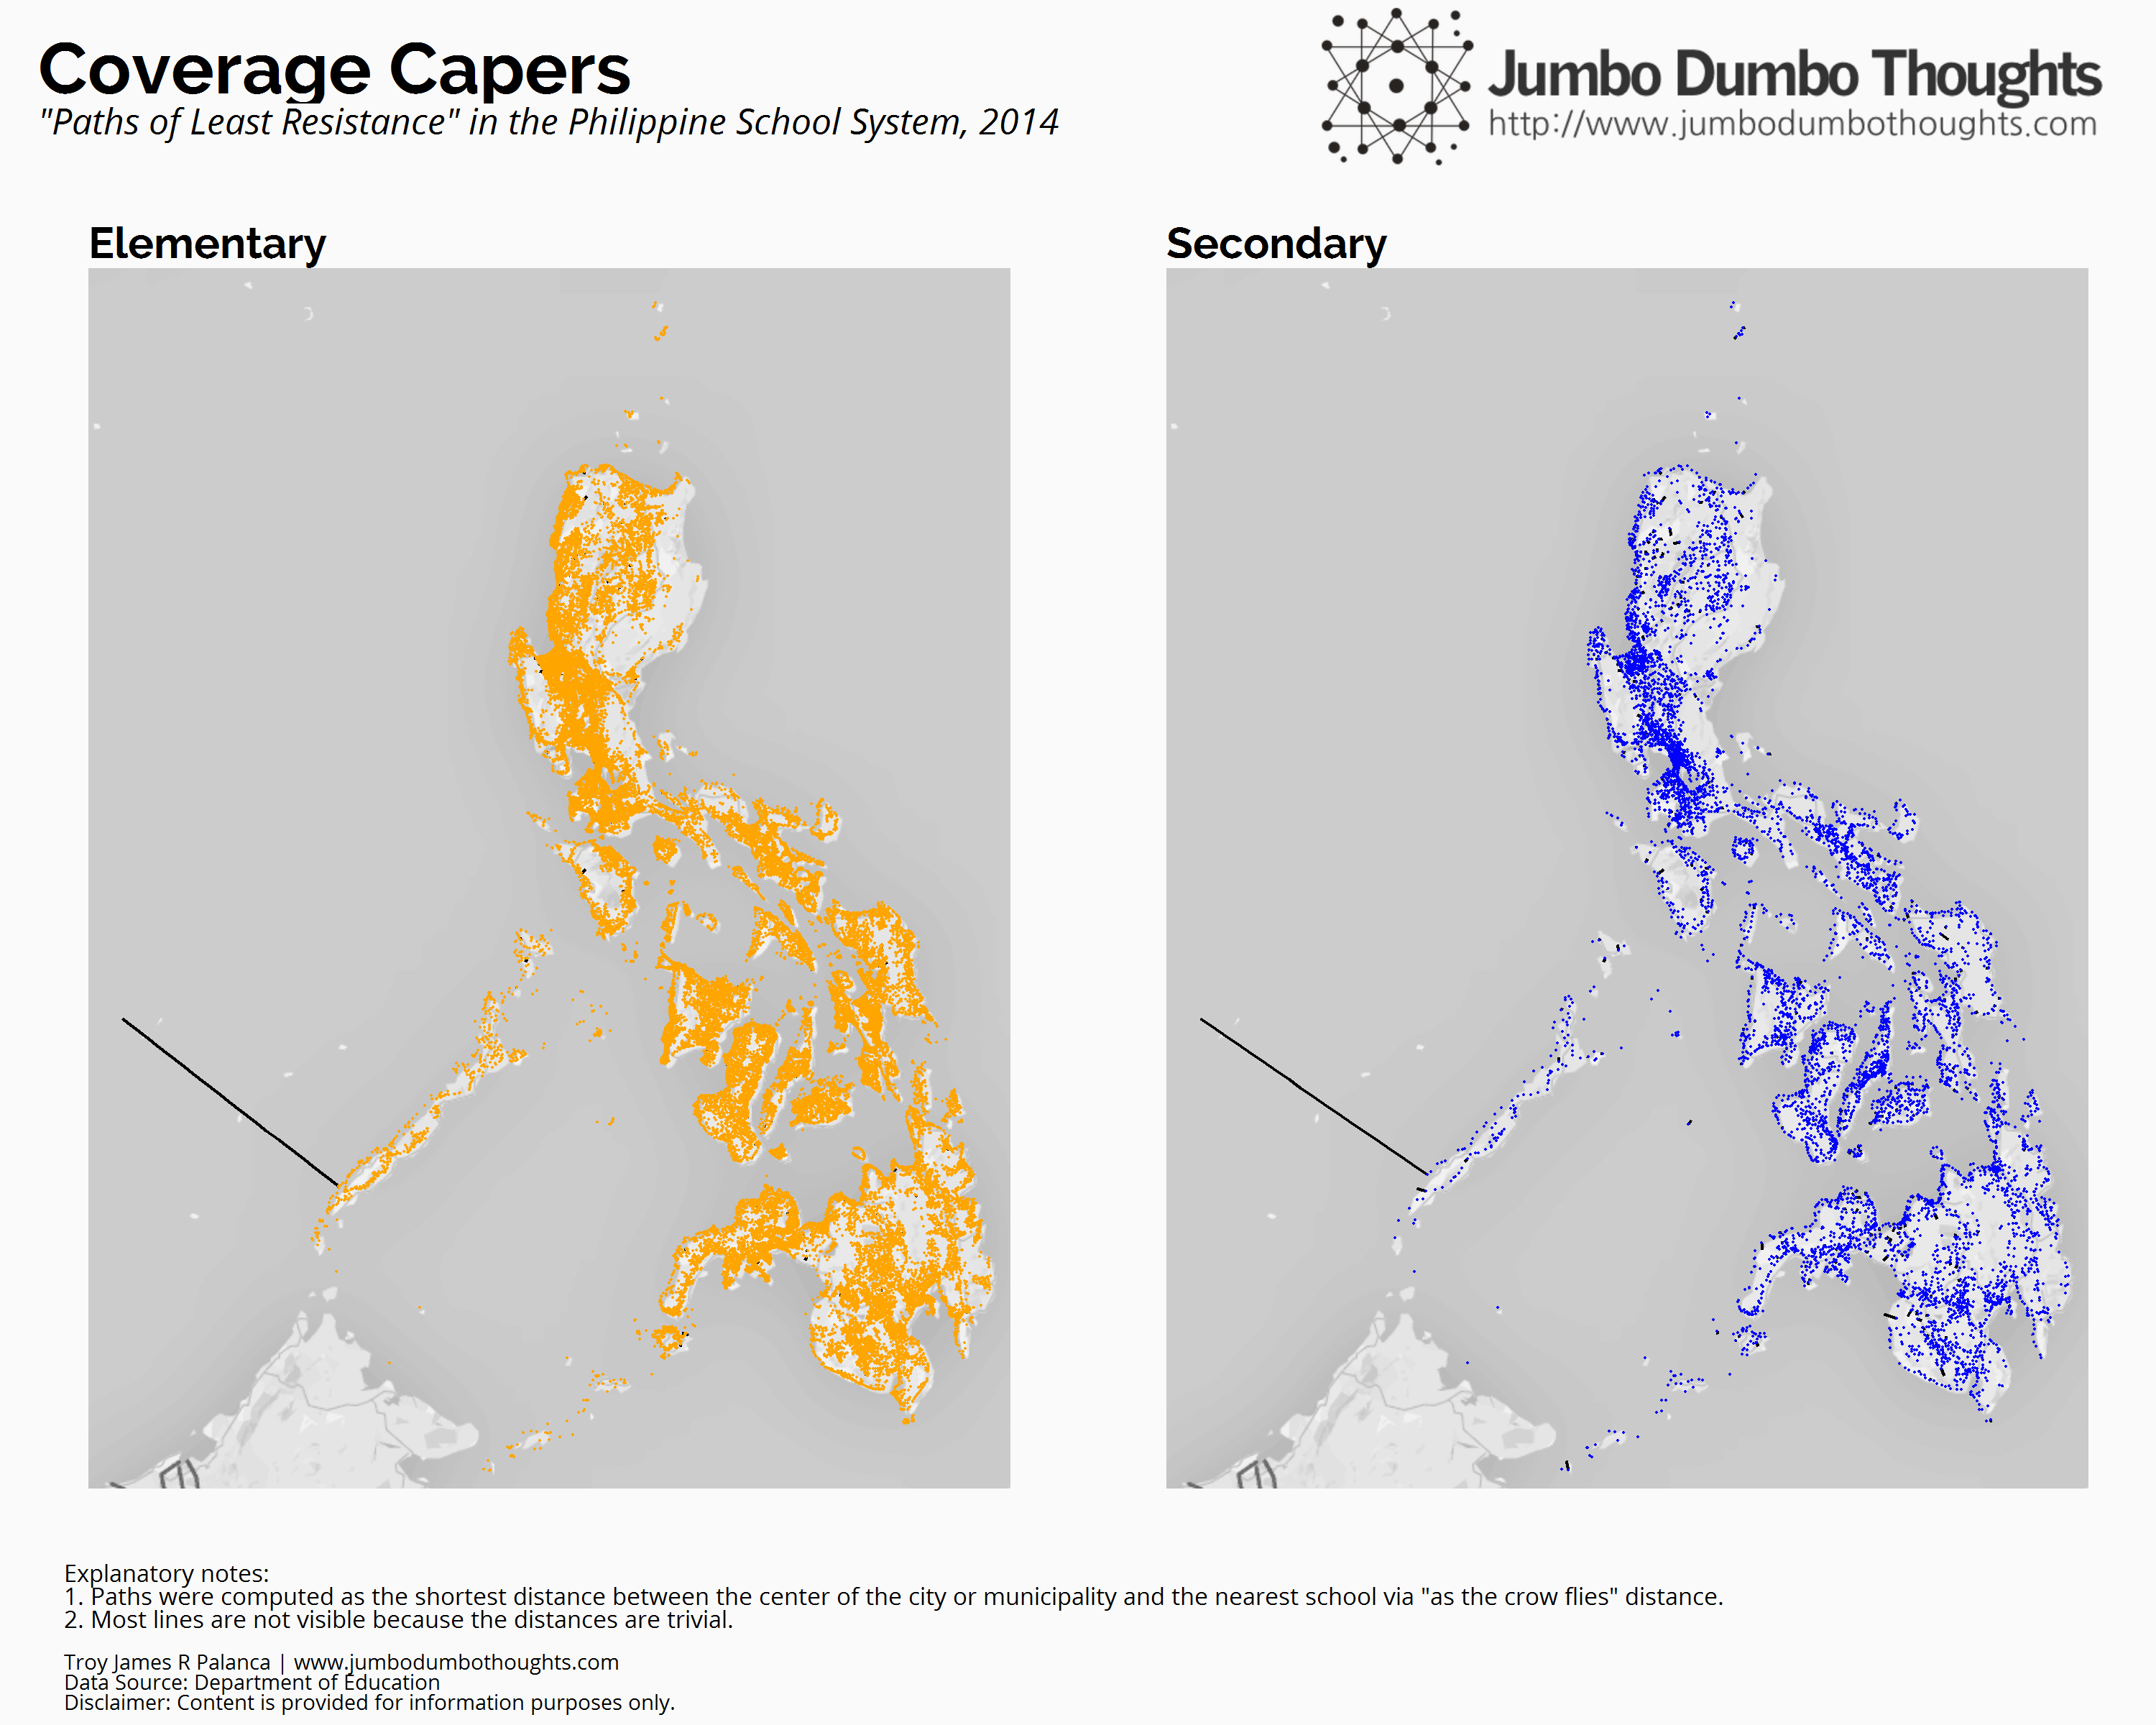
It would seem that coverage is pretty good. All but one city/municipality is close to an elementary or secondary school. That lone municipality is Kalayaan, in the disputed area of the Spratly islands. Clearly, the educational system is not in a lack of coverage.
Capacity Clusters
We have a dataset composed of thousands of schools, but many of them share the same characteristics in terms of capacity. In order to make sense of this all, we apply a clustering algorithm to automatically group together similar schools. For elementary schools, the clusters are as follows:
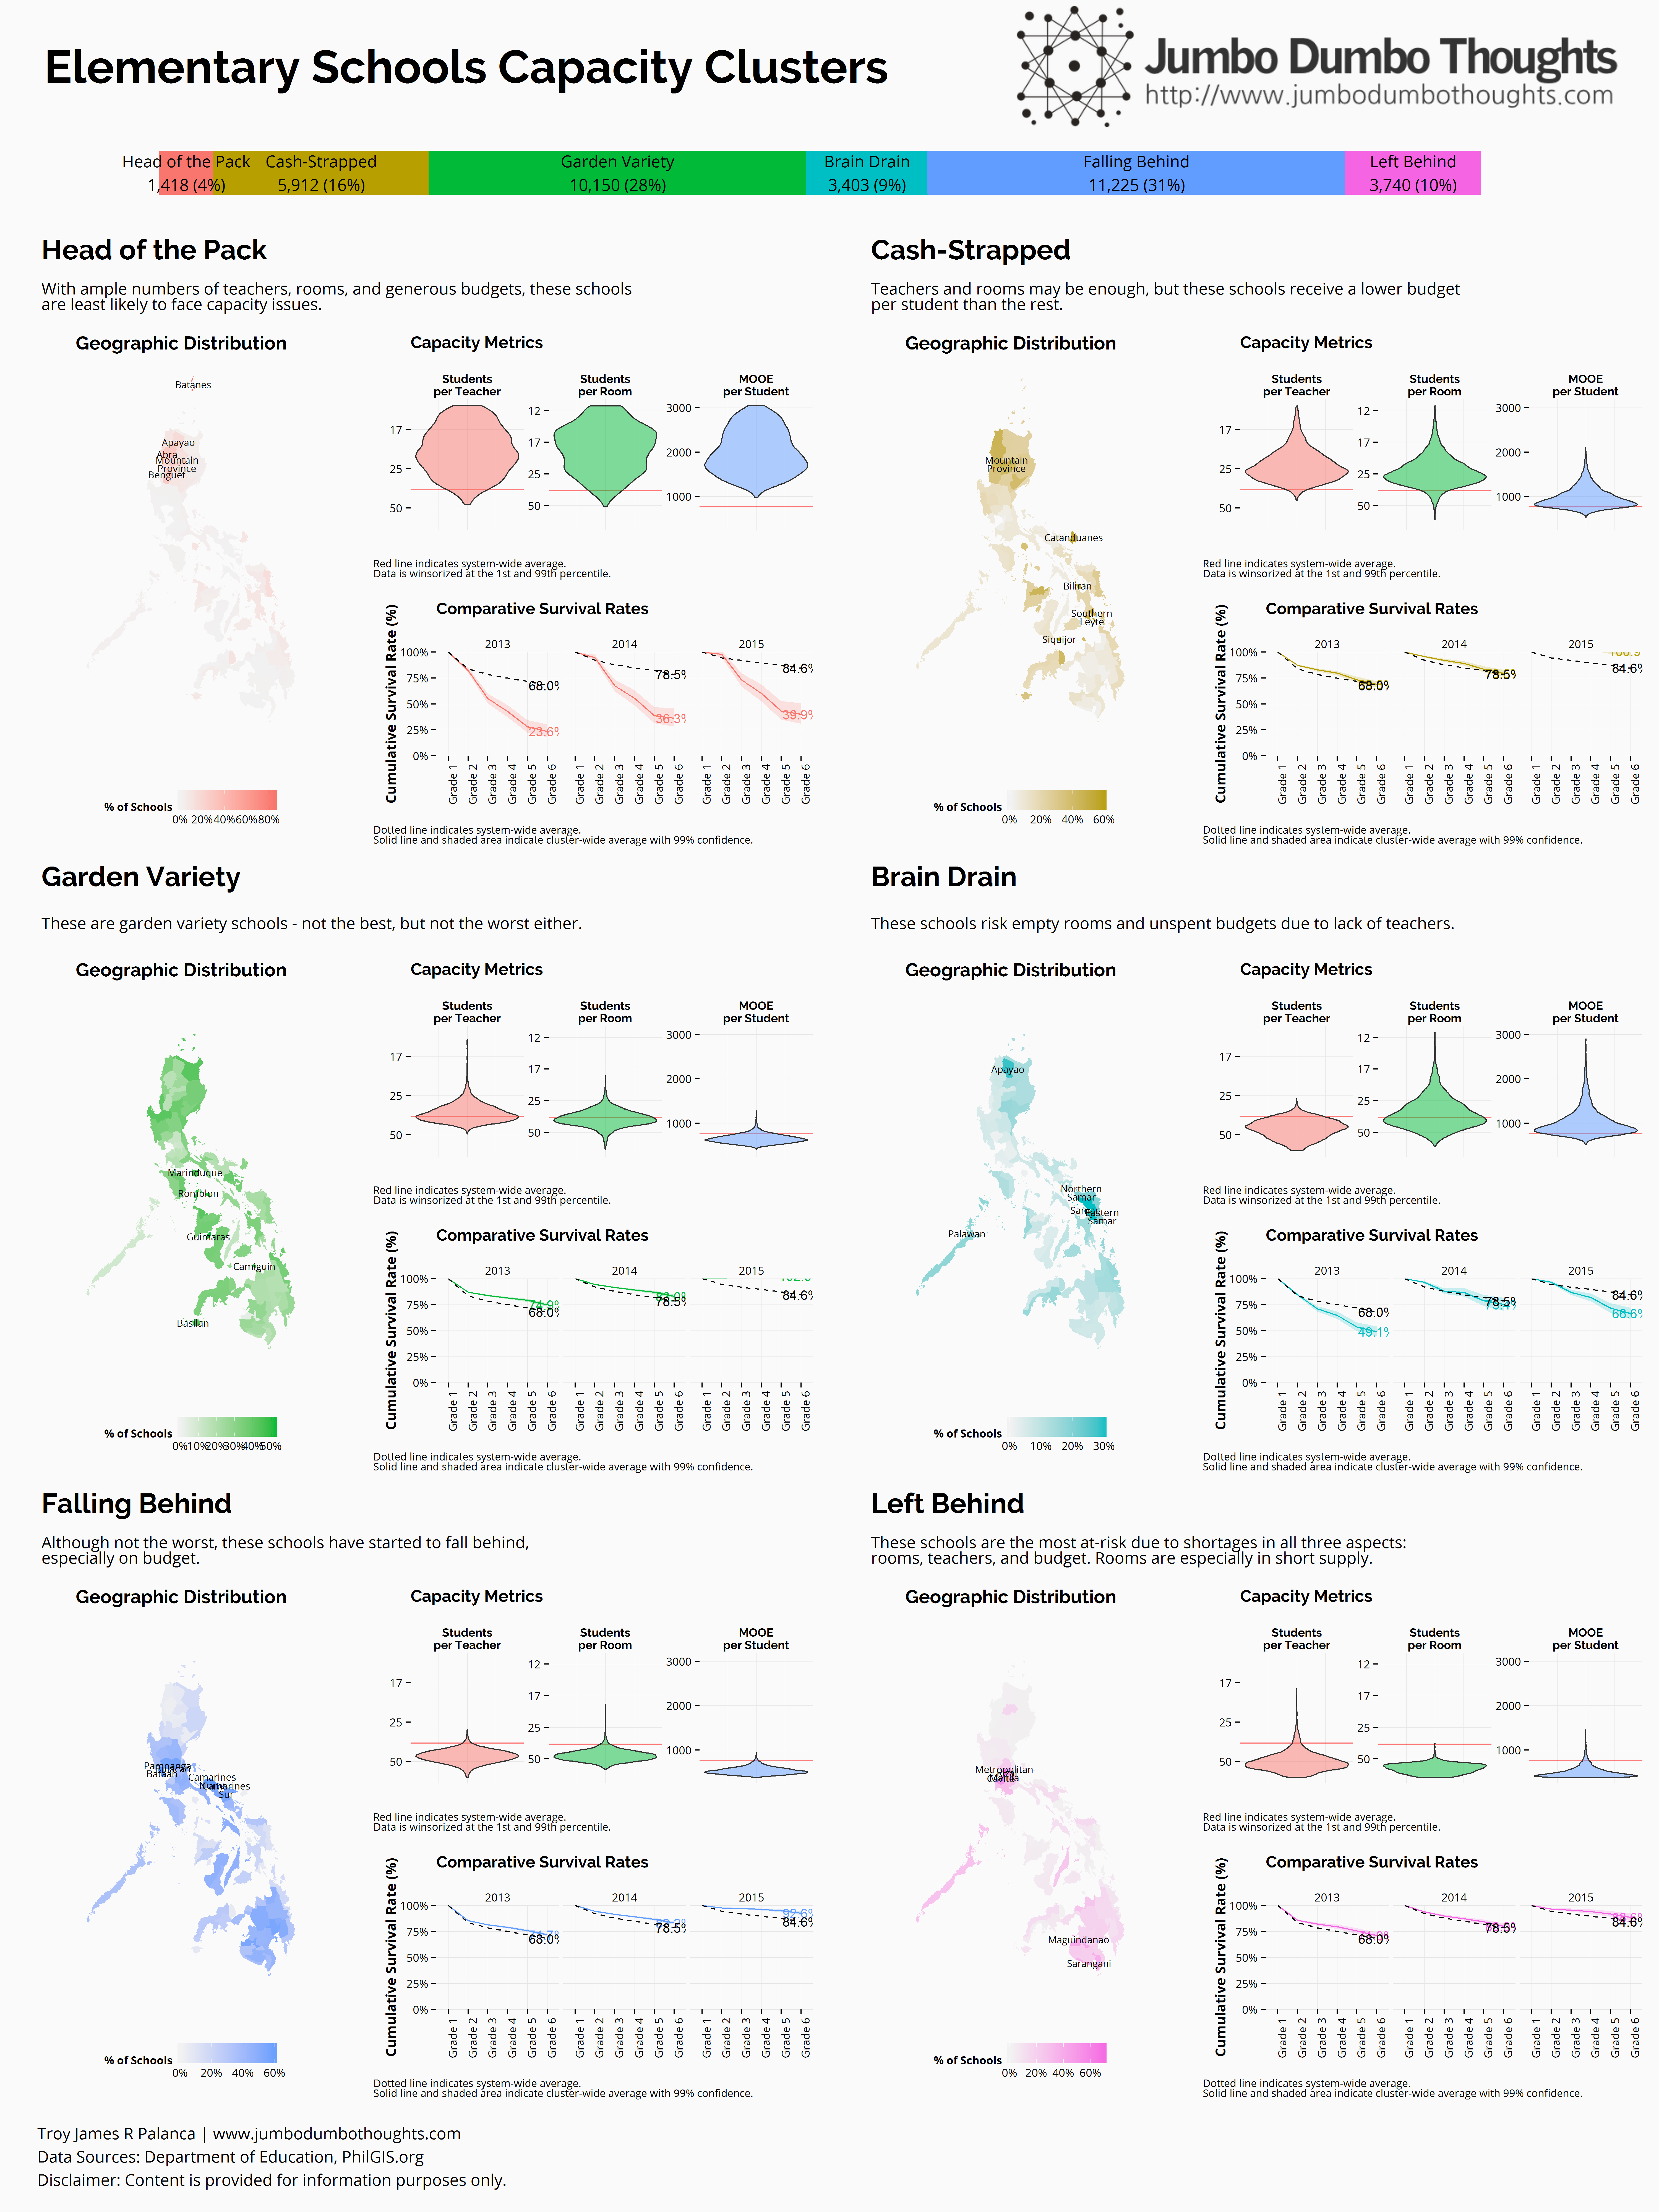
I’ve taken the liberty of naming the clusters based on my observation. Take note that these clusters are only defined based on capacity and not on any other metric. Here’s my description of each cluster after a perusal of the data:
- Head of the Pack. This cluster is high on capacity and is concentrated mainly in Northern Luzon, at around 20 students per teacher and room and a healthy budget. However, this capacity surplus is probably because of the high dropout rates in the area.
- Cash-Strapped. These schools are good on teachers and rooms, but not so much on budget. They are concentrated around the Eastern seaboard of the country. Dropout rates are comparative to the national average.
- Garden Variety These schools are roughly in the middle. They are in the Western seaboard and boast comparatively better dropout rates.
- Brain Drain. Teachers are in short supply in these areas, concentrated in Samar island. Dropout rates are increasing in this area.
- Falling Behind. A majority of schools are in this cluster, mainly located in the Bicol Region and Central Luzon. They are beginning to lag in all three capacity metrics. However, this is not so bad as dropout rates are comparatively better, causing supply shortages.
- Left Behind. These schools are in the lowest end, with average survival rates. At around 50 students per teacher and room, with budgets stretching to P500 per student, these schools are in desperate need of capacity. While the Southern provinces of Maguindanao and Sarangani contain these schools, majority are concentrated in Metro Manila.
For secondary schools, the clusters that I’ve discovered are as follows:

Secondary schools comprise mostly the same clusters, with a few differences:
- Teacher shortages are mainly in Western Visayas and Western Mindanao.
- There are severe secondary room shortages in Metro Manila.
- None of these capacity surpluses are due to dropouts, so any capacity shortages should be well-cured by a capacity infusion.
There you go! A brief study of capacity in the Philippine educational system. In the next part of the series we’ll explore how to reallocate capacity around the system to make do with what we have.
Thanks for reading! If you liked this post or found it interesting, I would appreciate it if you liked, shared, tweeted, or +1ed it on your preferred social network. Data, code, and computation requests may be made through the blog contact form.
Important Links
2015/11/edudata-2-coverage-capacity.html
content/blog/2015-05-16-mrt-capacity-conundrum/mrt-capacity-conundrum.html
posts/2015-05-16-mrt-capacity-conundrum
articles/edudata-2-coverage-capacity