Philippines
On the S&P Credit Rating Upgrade: The Numbers Behind BBB
Ratings agency Standard & Poor’s (S&P) has raised the Philippines sovereign credit rating from BBB- to BBB, making it fully in the ranks of investment-grade sovereign debt. Let’s look through those three B’s and look at the data behind their decision.
CREDIT UPGRADE - Credit rating’s, despite focusing on government-issued debt, include a variety of factors, such as political and economic risks, and are thus used to gauge the overall creditworthiness and economic outlook of a country’s economy. In this photos is Makati City, the central business district of the country. (Photo: chattygd/Flickr, CC BY 2.0)
The Philippines has received yet another credit rating upgrade, from BBB- to BBB, nudging it further into investment-grade territory. What do these letters really mean, though? We can take a look at the data that S&P has provided in support of their decision in this main and supplementary article, to find out more.
Before we look at the data, let’s define sovereign credit ratings. These ratings are regularly provided by ratings agencies (that largest of which are S&P, Fitch, and Moody’s) on sovereign debt or government issued debt, as a measure of the ability of a certain government to repay debt. Because governments ability to pay is dependent on various risks - political risks can cause policy changes, economic risks can cause changes in tax revenue - these ratings are also used to assess the general economic environment in a country.
The numbers that we will look at are all based on S&P reports. Take note that the figures for 2013 are expected figures, and those for 2014 onwards are forecasts developed by S&P.
Economic and Financial Indicators: Full Steam Ahead!
The first category of indicators that S&P uses in its assessment are economic and financial indicators that relate primarily to the internal economy and how it is able to generate and continue generating income and tax revenues.

GDP growth (upper-left) has been at a very impressive 4%-7% after the impact of the US financial crisis faded in 2009, and is expected to stay within 6% up to 2016. GDP per capita growth, which discounts the effect of population growth, is steady, implying that economic growth will continue to keep pace with the population. The same is true for number of employees. The fact that GDP per capita growth is expected to be higher than GDP per employee growth is because of the expanding labor force or demographic transition.
Investment and external demand (exports) (lower-left) have been the key drivers of growth for the Philippines, especially in 2010 when investors fled from the troubled US and Europe markets and into emerging markets. Domestic demand has little impact on economic growth.
Good news! Unemployment and inflation (upper-right) have both been on a downward trend - a very rare and exciting economic phenomenon. This suggests an increase in real wages, so that more people can feel the impact of increased economic growth.
Savings rates (lower-right) are not that impressive, hovering at around 25% and expected to fall further up to 2016. This is mitigated by the fact that more of these loanable funds will be used in productive investment, keeping the level of investment constant in relation to output.
S&P cites the public-private partnership program as one of the factors for boosting infrastructure projects, but identifies low GDP per capita levels and slow employment growth as key rating constraints.
External and Debt Indicators: Paying down the debt
The second category of indicators concerns the economy’s interaction with the world at large - foreign investment, foreign debt, and capital flows between the Philippines and the rest of the world.
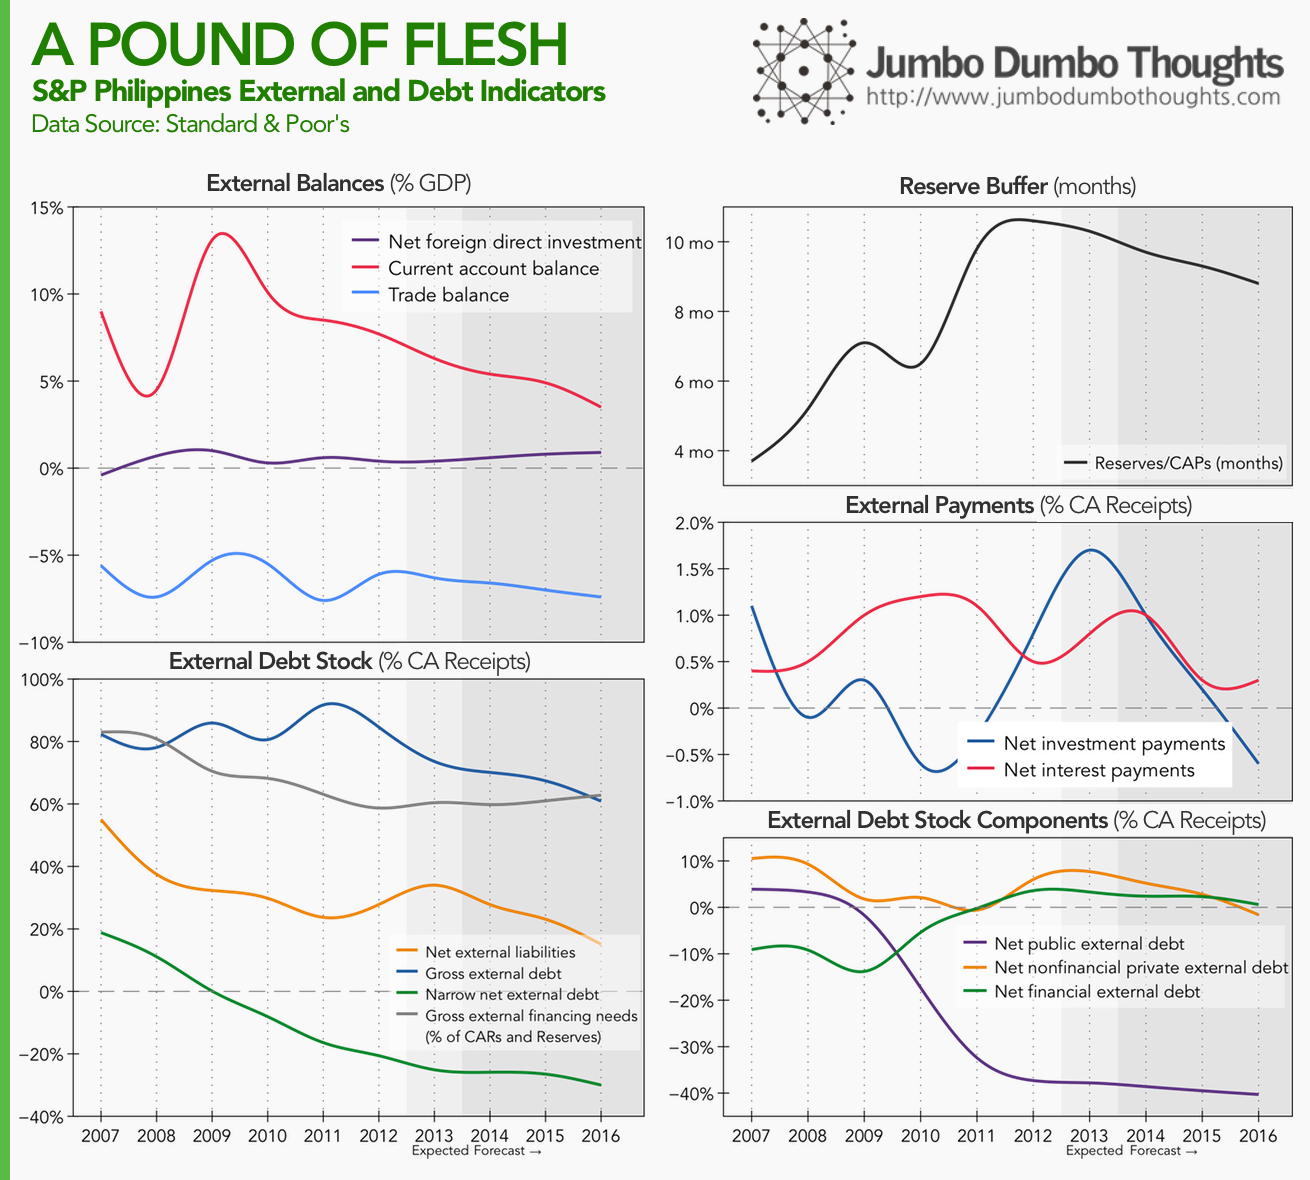
The Philippines' economic performance has caused an improvement in its debt standing. In terms of external balances, current account (upper-left) has stayed at a surplus, meaning that the country is a net lender to the rest of the world. This is because of large OFW remittances, evidenced by the large variance between foreign investment and the current account surplus. The current account surplus is expected to diminish in the future.
In terms of external debt stock (lower-left), all broad and narrow measures of debt are falling. Furthermore, narrow net external debt at a negative level means that we are less vulnerable to shocks if investors decide to pull their funds out of the country since it’s now a net external lender. However, gross external financing needs are still high at 60% to 80%, probably because of reliance on OFW remittances, and more recently the BPO sector. S&P doesn’t expect these inflows to stop anytime soon, however.
The reserve buffer (upper-right) is high; the country can last 9 to 10 months if funds continuously flow out of the country, without any receipts. In 2015, we can expect to be a foreign investor country ourselves, with net investment payments (middle-right) below zero. Net interest payments are also expected to fall.
If we look at who is contributing to the decrease in the country’s debt (lower-right), it’s amazingly the government (public external debt) that’s getting its foreign debt standing together and thus releasing loanable funds for investment in the private sector.
Fiscal Indicators: Prudent Government
The third category of indicators exhibited by S&P relates to fiscal standing, or how well the government is handling its finances (from a strictly inflow-outflow perspective, where those funds come from, and go, is a different question entirely).
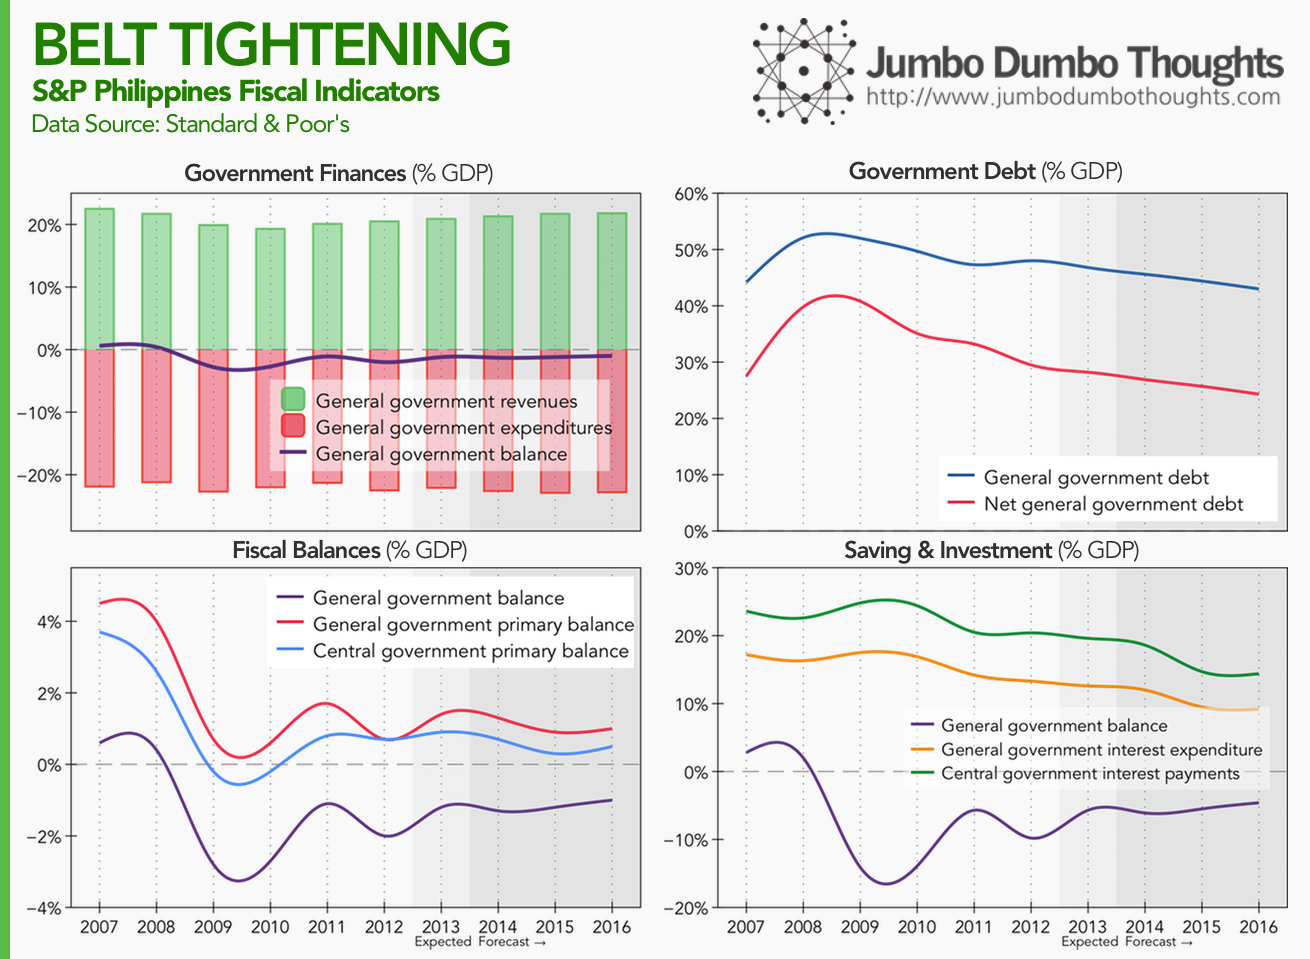
Government has been able to stay at a slight deficit (upper-left), managing its revenues and expenditures quite well. Furthermore, if we remove the impact of interest payments on preexisting government debt (the resulting measure is known as the government primary balance), the figures (lower-left) for both general government (which includes LGUs and GOCCs) and central government are on the positive, meaning that government can support its operations with current receipts and continue paying down debt and subsequently incurring lower interest expense, which is seen in the upper-right panel and the lower-right panel, respectively. However, S&P cites lack of infrastructure and efficient government programs as constraints.
Other Considerations
S&P also assesses monetary policy by the central bank, cites low domestic debt levels, well-anchored and credible monetary policy, and low inflation, as risk-reducing factors, but also notes that high-risk lending to a potentially overheating property sector and underdeveloped capital markets that limit monetary policy transmission as risks.
That’s the data behind the BBB rating. Hopefully, you can now see where specifically the Philippines has improved, has faltered, and has jogged in place. Hope you enjoyed reading!
Thanks for reading! If you found this post interesting, I’d really appreciate a share on your social networks or a comment with your thoughts. Data is taken from the S&P supplementary article.
aliases:
  - 2014/06/on-sp-credit-rating-upgrade.html
  - content/blog/2014-06-01-on-sp-credit-rating-upgrade/on-sp-credit-rating-upgrade.html
  - posts/2014-06-01-on-sp-credit-rating-upgrade
  - articles/on-sp-credit-rating-upgrade
On the Filipino Migration and Remittances: The grass is still greener on the other side
The Filipino diaspora has been a relatively well-documented phenomenon, as poor circumstances in the domestic economy nudge others to seek greener pastures abroad. But where exactly do these people go, and how have the trends changed since 1990? Also, are there any people coming in to the country? Let’s take a look at the data.
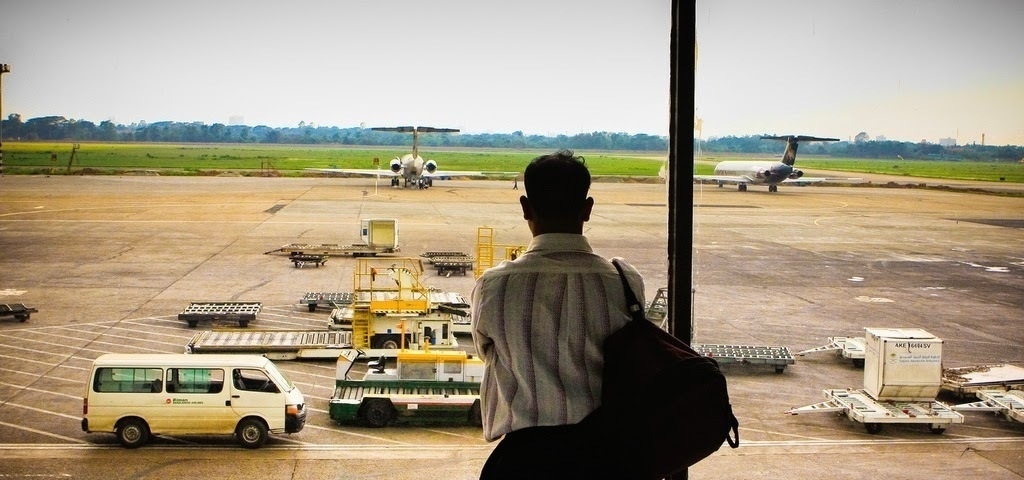
LEAVING ON A JET PLANE. Where do these Filipino migrants go, and which nationalities migrate into the Philippines? In this photo, a migrant worker from Bangladesh, a country which faces similar economic circumstances as the Philippines, awaits his flight. (Photo: Faisal Akram/Flickr, CC BY-SA 2.0)
Economic circumstances and an oversupply of labor in the domestic market have caused what some people have called the Filipino diaspora - a large outflow of migrant workers and overseas contract workers seeking better jobs - and pay - abroad.
On What It Means to Be Filipino

Culture has always been tricky to measure, but by asking the right questions we can get a grasp of how Filipinos think. In this photo, hot ai’r balloons fly at the 16th International Hot Air Balloon Fiesta in Subic, Philippines. (Photo: Lady May Pamintuan/Flickr, CC BY-ND 2.0)
What’s important in life? What do you want in a job? Is suicide justifiable? Would you want a drug addict as a neighbor? How many children would you like to have? Do you have confidence in the church? Find out how Filipinos responded to these types of questions using data from the World Values Survey.
On Delays and Dropouts: A Data Primer on Education

A data-driven look at education reveals large and increasing disparities between regions and gender in terms of enrollment, and also a bleak compensation package for teachers. (Photo: Sean MacEntee/Flickr, CC BY 2.0)
How does the Philippine education system look like through numbers? With new data from the Department of Education posted on the wonderful data.gov.ph, we can generate some interesting snapshots that allow us to assess how the country is doing at teaching future generations.
On Using Data to Choose your Next Vacation Destination

TRAVEL OFTEN - Data from the OpenFlights database can show you all the destinations available for your travelling pleasure. (Photo: Pixabay, public domain)
Are you having trouble making vacation plans? Well, the first step to planning any trip would be to decide on a destination, whether it be domestic or international. However, there isn’t an easy way to take a look at all your alternatives: what are the destinations to which the Philippines has direct flights?
Luckily, data from the OpenFlights database is available, listing a wide variety of air travel routes around the world, the Philippines included. We can use it to construct a data visualization called a circular dendrogram. All the direct routes from the Philippines can be laid out in an orderly, easily explorable manner.
On Presidents and Priorities: Distilling the Numbers out of the State of the Nation Address
We can distill the numbers out of speeches to determine what our commanders-in-chief have prioritized over the years of the Philippine democracy. In this photo, President Benigno Aquino III, the current president of the Philippines, delivers his second State of the Nation Address in 2011. (PUBLIC DOMAIN)
The President’s annual State of the Nation Address (SONA) is a strong indicator of an administration’s priorities and accomplishments, but how do we compare across presidents? We can distill the SONA into numbers and count instances of national issues mentioned in the speech to find out and compare. You can also explore the speeches yourself using an interactive SONA word counter.
History through the President’s Words
I got this great data gathering idea from an awesome article on the Washington Post, which analyzed the State of the Union Addresses of the various US presidents to determine hot-button issues in the United States. I decided to apply the same methodology to the Philippines and extract word counts out of the various State of the Nation Addresses, from Cory Aquino in 1987 to Noynoy Aquino in 2013.
Length of Speech and the Riffraff Index
First, let’s take a look at a very basic statistic - the length of the speech in words - as well as something I constructed called the Riffraff Index, which is the percentage of words in the SONA that do not specifically relate to any national issue. What these words are, and how they were selected are at the next section.
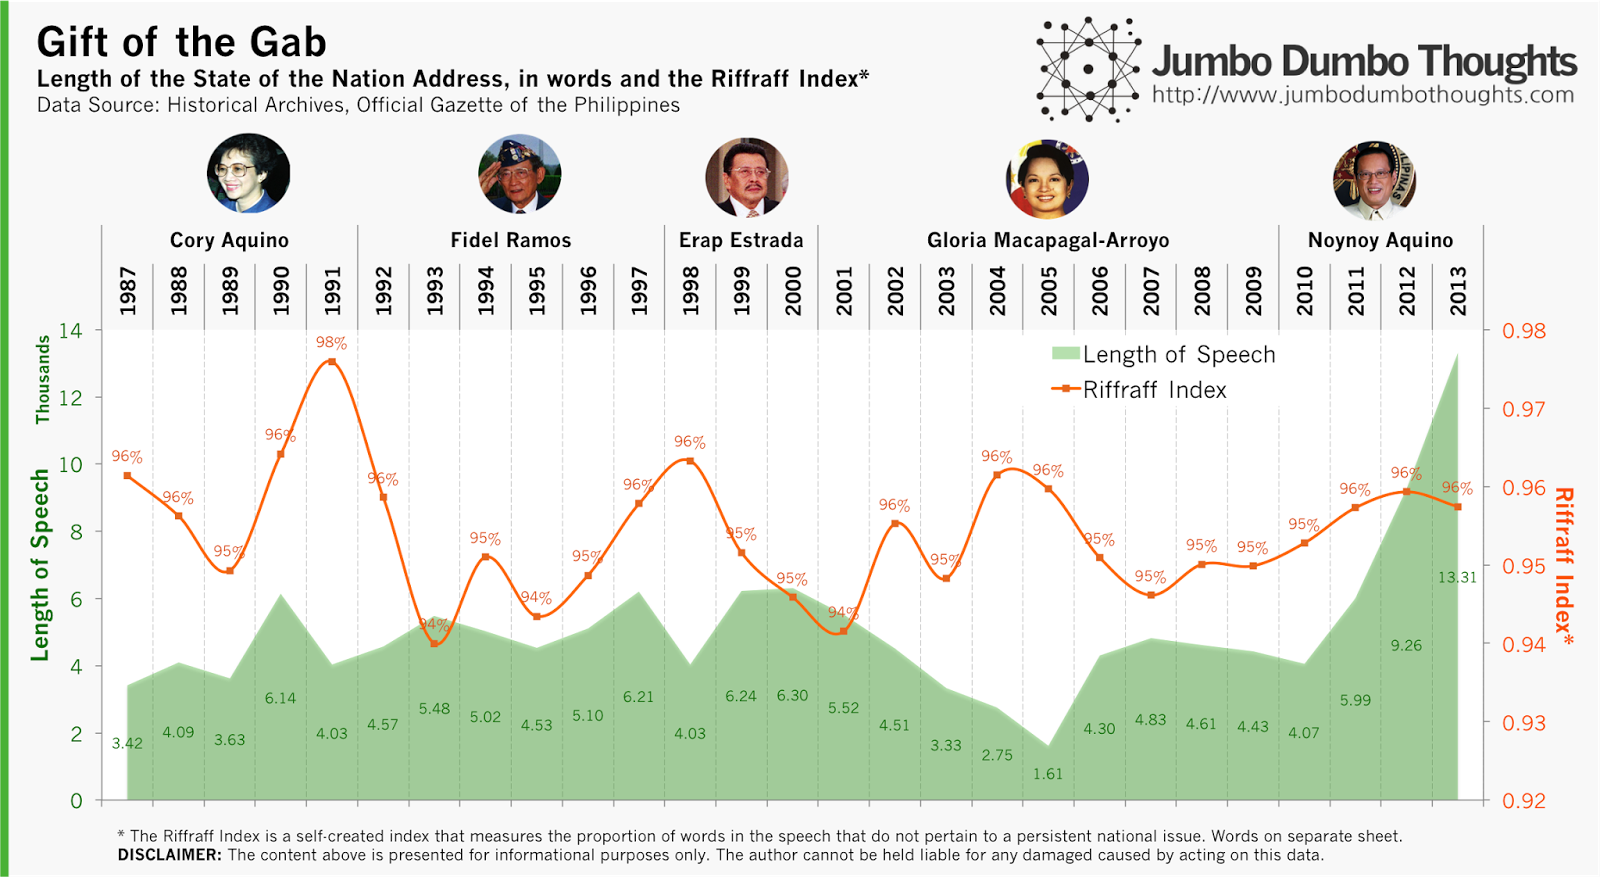
The shortest speech was delivered by Gloria Macapagal-Arroyo in 2005 at only 1,600 words, while the longest was actually the most recent one by Noynoy Aquino, clocking in at a whopping 13,300 words.
But a long speech doesn’t mean a meaningful one - you could fill your speech with buzzwords and riffraff to make it longer, so I constructed the Riffraff Index - the percentage of words that do not appear to relate to a specific national issue (the higher the index, the more riffraff). The highest amount of ‘riffraff’ was during Cory Aquino’s 1991 farewell speech - a very heartfelt and emotional speech, while the lowest was during Ramos' 1993 speech - one where Fidel Ramos identified key issues and discussed them in immense detail.
You can also see that the amount of riffraff increases during election periods (1991-1992, 1997-1998, 2004) except for the most recent one.
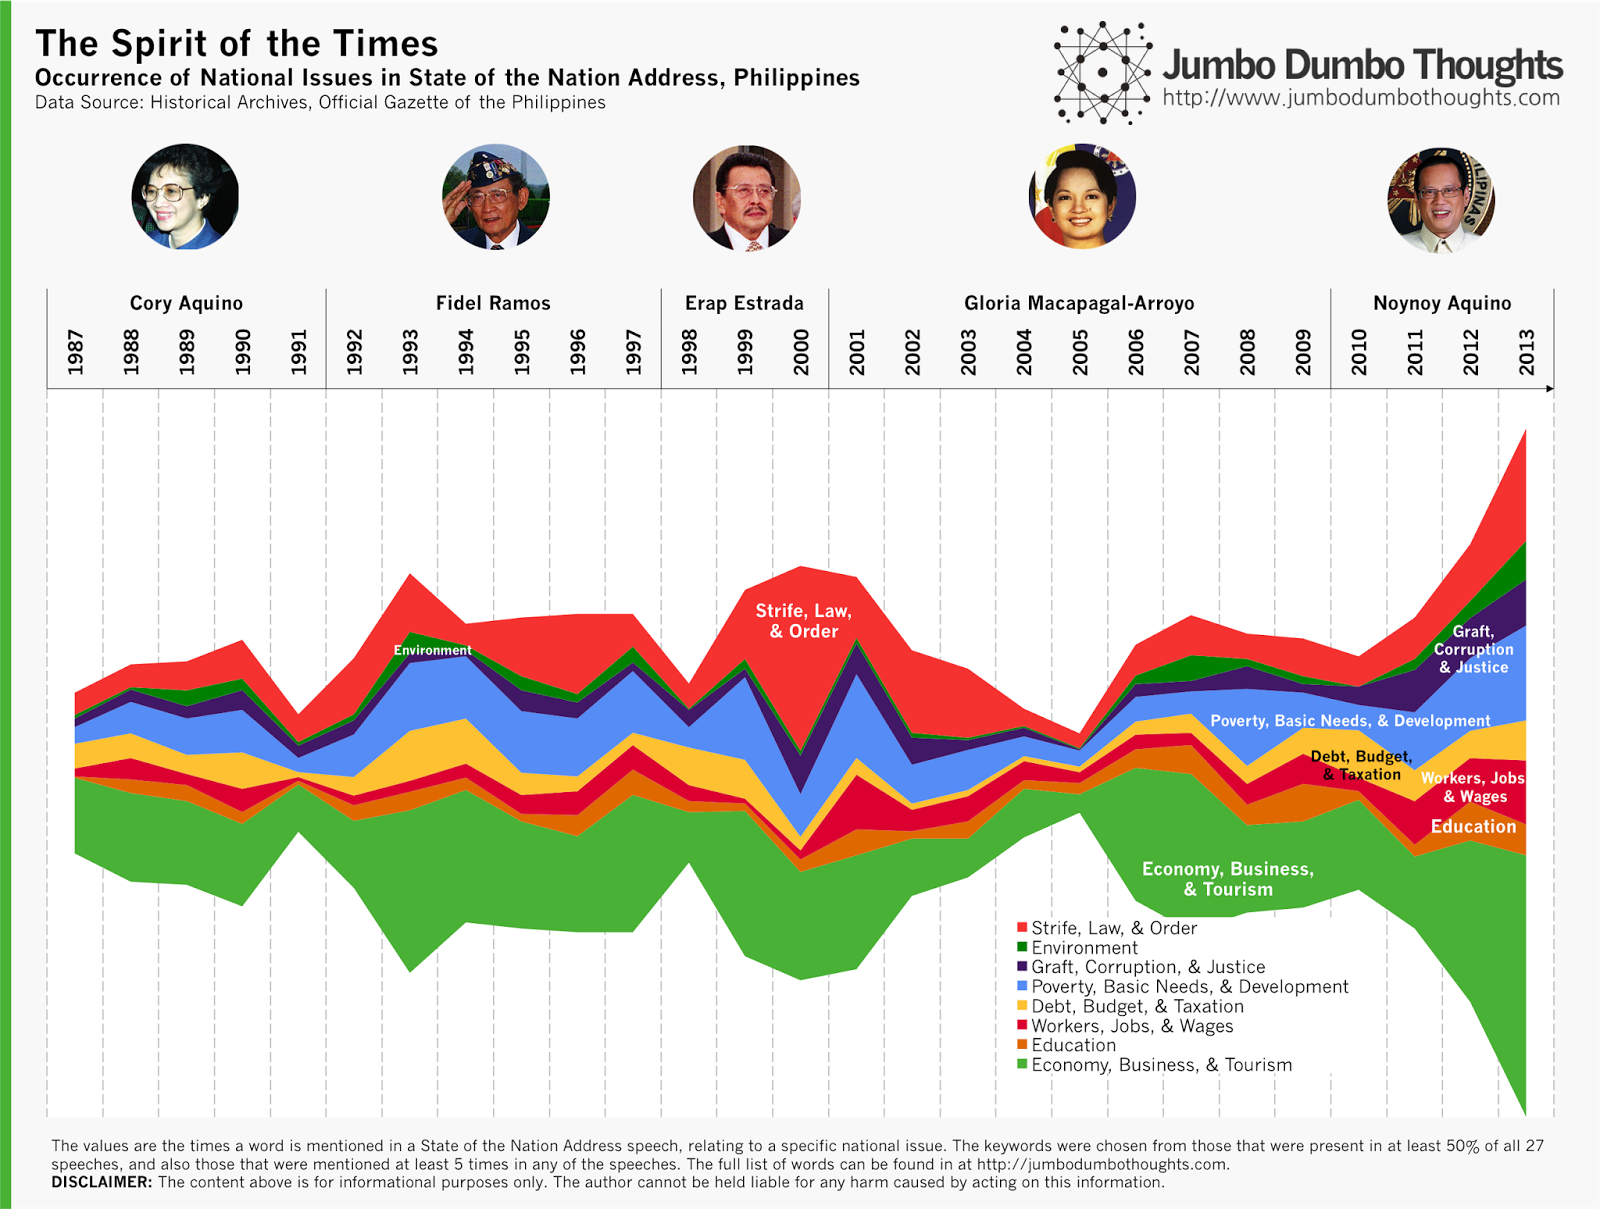
Zeitgeist
That’s not all we could do with this data. We can also pinpoint the specific national issues each president spent the most time talking about in his/her SONA, so we identified keywords from those that were mentioned in at least 14 out of the 27 speeches, and also those that were mentioned at least 5 times in any one speech. We then categorize them into various issues, as follows:
The full list of keywords and their categories can be viewed here
Economy, strife, law and order, and poverty are quite often discussed across the administrations, and varying degrees exist for other issues. Environment is least talked about in presidential speeches, and understandably so for a developing country with a small environmental footprint.
You can also observe that issues tend to be most talked about during the middle of a President’s term, and the values shrink as they become mum during election periods - probably to stay on the safe side.
Presidential Priorities
But this streamgraph doesn’t make it easy to compare the priorities of each president relative to each other, so I constructed a heatmap that compares the favorite issues of each chief executive relative to his predecessors and/or successors:
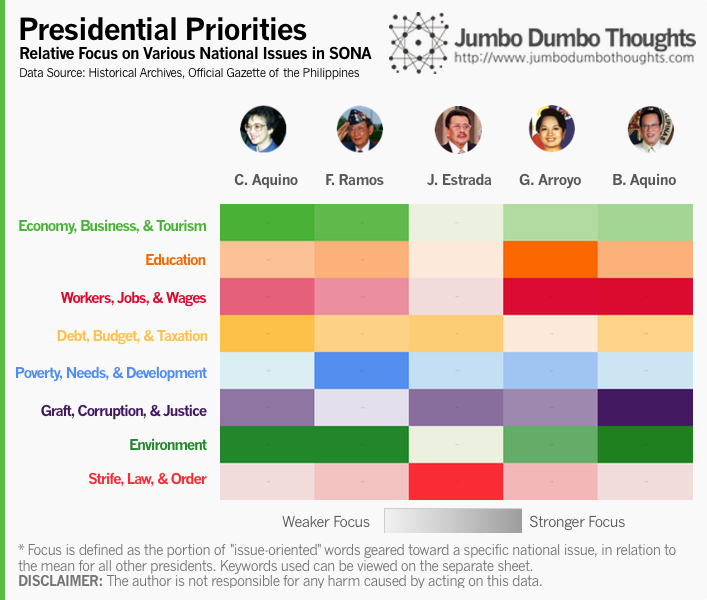
Cory Aquino stayed pretty much balanced across the various issues. Fidel Ramos talked mostly about curbing poverty, protecting the environment, and improving the economy. Estrada talked about little else than strife, law, & order - his last SONA talked almost exclusively about the MILF and Mindanao. GMA focused on workers, jobs, wages, and education, which she has consistently stressed throughout her administration. Finally and not surprisingly, our current President is big on employment as well as graft, corruption and justice.
SONA Interactive Word Counter
All this information is too rich to summarize easily, so I’ve decided to construct a simple tool (like Google’s n-gram viewer) to let you explore the SONA data for yourself. You can enter up to 5 words in the white boxes, and the line graph on the right will show how many mentions that particular word gets in each SONA from 1987’s Aquino to 2013’s Aquino.
You might have to wait a few seconds to update the chart upon entering information. Sorry for the clunky Excel implementation, as I have very little coding ability. (Use a space to clear out a cell)
Unfortunately, this link has expired and I don’t have time to recover it.
Hope you enjoy discovering new trends with the tool! If you find an interesting pattern, please don’t hesitate to share it in the comments!
Thanks for reading! If you enjoyed reading, I’d appreciate it if you shared this with your friends or comment below. Data and computation inquiries can be made through the contact form or the comments.
aliases:
  - 2014/02/sona-words.html
  - content/blog/2014-02-18-sona-words/sona-words.html
  - posts/2014-02-18-sona-words
  - articles/sona-words
On the Philippine IT-BPO Industry- 'Bayaning Puyat' or Dead-end Job
Many skilled Filipinos detest the idea of working in a call center, but is that position justified? In this photo is the Ortigas skyline, one of the central business districts in Manila, the capital.(Photo: RamirBorja/Wikimedia, CC BY-SA 2.5)
The call center industry, or more widely called IT-BPO, has received its fair share of praise for contributing to economic and job growth, but a job in this industry still carries the stigma of low pay and low skill. We can take a look at the IT-BPO industry using data from the Bangko Sentral ng Pilipinas to shed some light on the graveyard shift.