Articles
An article is a finished piece of work, likely the result of a data analysis or a viewpoint that's gone through multiple iterations of feedback and refinement. It's intended to be the traditional blog post.
On Pump Prices: Where can you gas up for less?
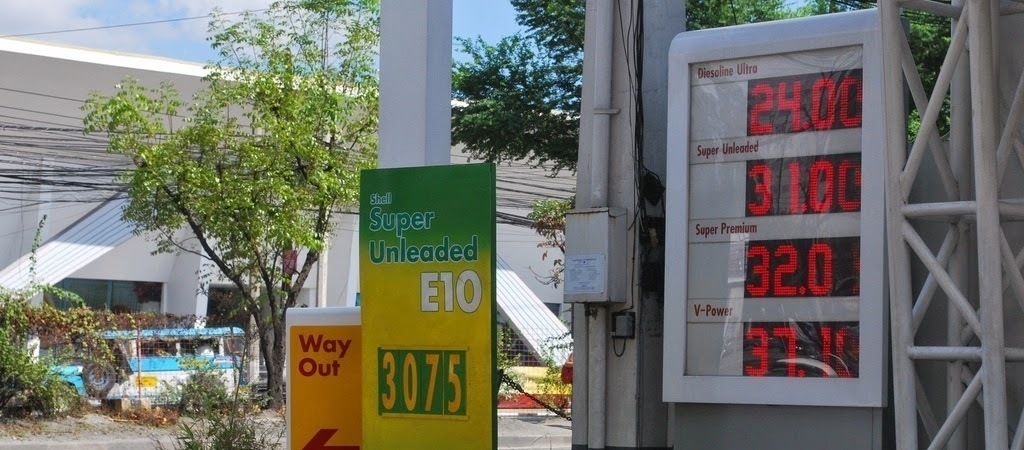
BLACK GOLD - In a time of risi’ng oil prices, it might pay off to be a little more data-savvy about where you gas up. (Photo: Patricia Feaster/Flickr, CC BY 2.0)
What providers let your stretch you gas money for more miles? Where is it more economical to gas up? Data from the Department of Energy’s price watch can provide some data-driven answers to these questions.
Everyone has something to say about gas prices - it’s cheaper to gas up with this provider than another, or it’s more economical to fill the tank in this area than another. With data from the Department of Energy’s price watch, we can provide data-driven answers to these questions, so that you can stretch out your gas money for just a few more kilometers.
On Taxes: Do Filipinos really pay the highest taxes among ASEAN countries
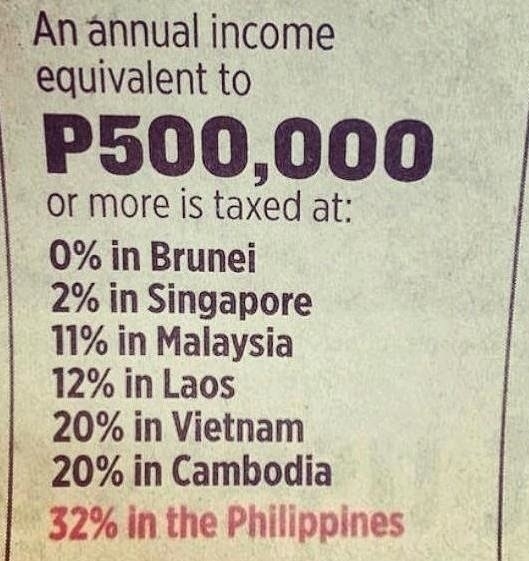
LABORIOUS LEVIES - This ad in a newspaper cites the claim of the Tax Management Association of the Philippines, taken from the Instagram account of Senator Sonny Angara, one of the main advocates for reducing income tax rates.
The Tax Management Association of the Philippines (TMAP) claims that Filipinos pay the highest tax rates among countries in the Association of Southeast Asian Nations (ASEAN). This is their basis for arguing in favor of lower income taxes and inflation-sensitive tax brackets.. While the debate on whether lower taxes can be an overall sound policy rages on, let’s focus on this particular claim and determine whether Filipinos really do pay the highest taxes in the region.
On Presidential Priorities (July 2014): Aquino moves toward legacy

Aquino’s 5th SONA word counts suggest a shift of focus from current national issues toward long-term legacies such as education, budget management, and poverty alleviation. However, the overall message echoed by the administration remains the same. (Photo: Official Gazette, public domain)
I previously wrote a post that tries to get a feel of the priorities of each administration at various points in time, by measuring how many times each speech mentions certain words that relate to national issues. Following the recent 2014 SONA of President Aquino, we update the data to see what’s changed, and whether there are any shifts in the priorities of his administration.
Please feel free to read the [[On Presidents and Priorities|original post]] to view how this data was collected, shaped, and presented.
The Basics: Length of speech and the Riffraff index
Let’s take a look at the overall length, and how much of the speech actually contained meaningful content, as measured by the Riffraff Index.
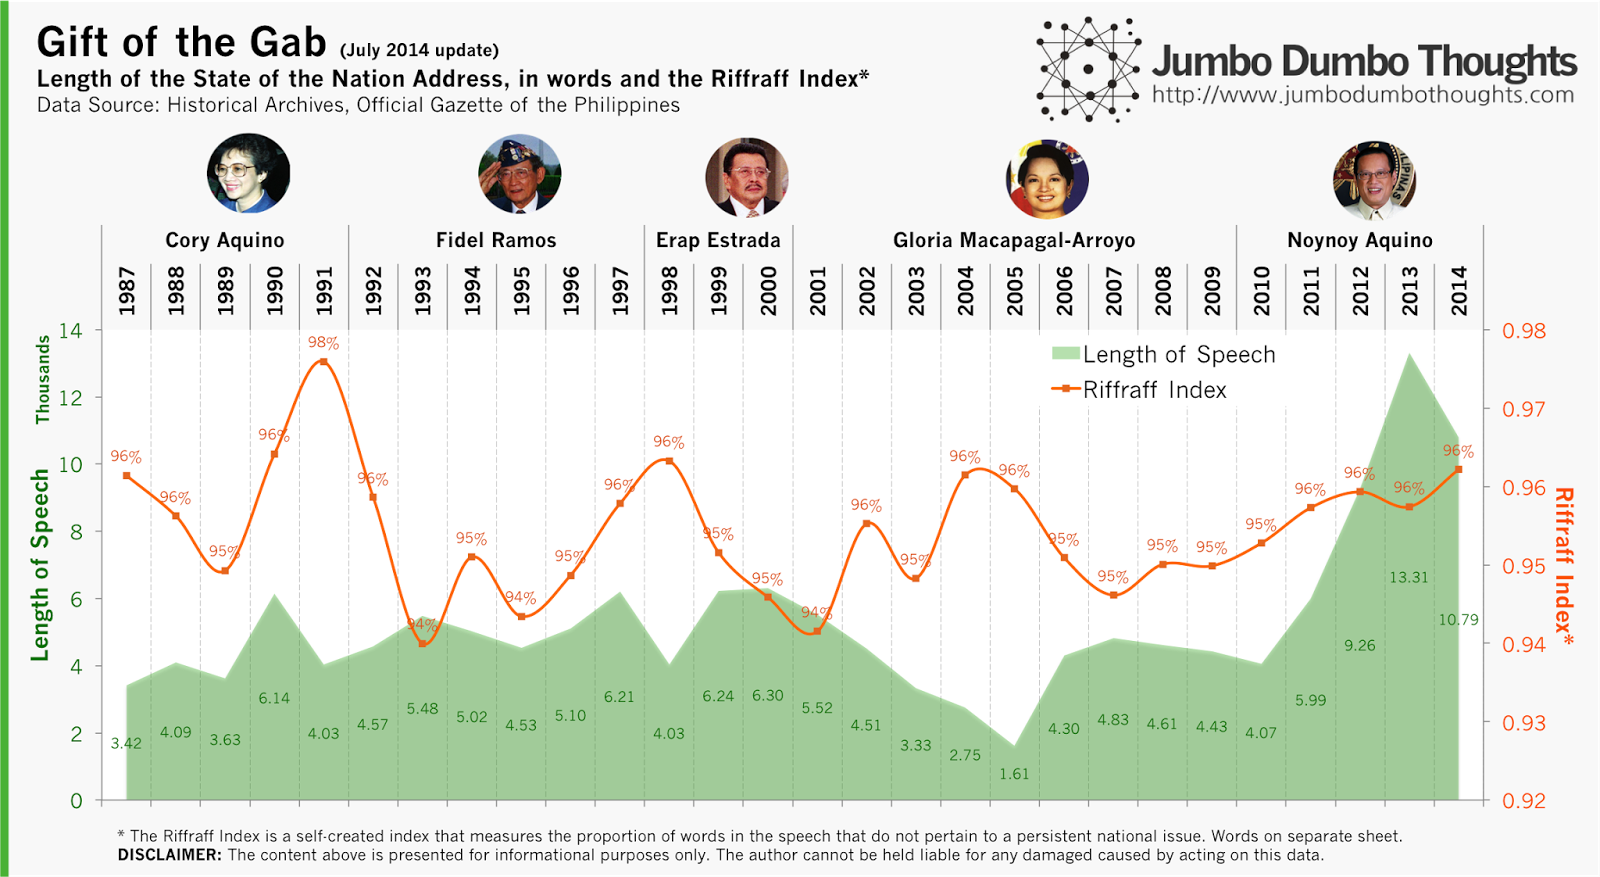
President Aquino’s 5th SONA is shorter than last year’s, but still quite long at around ten thousand words, making it the second longest SONA since his mother’s time. Despite this cutting down of length, the amount of riffraff increased, probably due to his lengthy discussion of various calamities and also the legacy statement near the end of the speech.
Presidential Priorities 2014: Education, government finance, and poverty
Let’s use the same criteria to determine the trends in the priorities of various administrations. Will it have changed for President Aquino? Let’s find out:

The President focused more on education (TESDA), poverty (poverty rate and conditional cash transfers), and government finance (debt management, investment rating upgrade) compared to previous speeches. There was less focus on environment and law and order compared to previous speeches. As the term ends, the administration might be focusing more on long-term legacies such as education and balancing government books rather than current issues such as corruption, law and order, economy, and employment.
Priority Heatmap: No change in overall priorities
How does the new data affect the overall priorities of the Aquino administration? The answer is: not much.
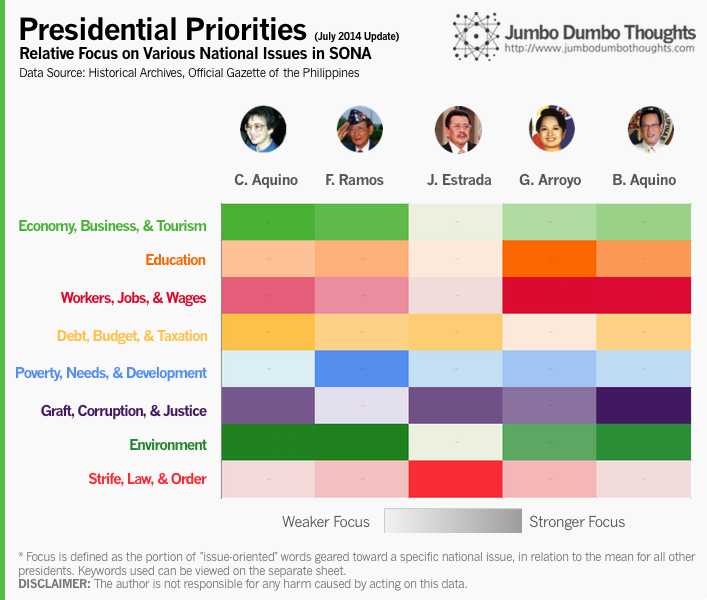
Overall, compared to other administrations, the Aquino administration is still very much focused on both graft, corruption, justice and workers, jobs, wages, with a slight shift towards education.
Interactive Word Counter
You don’t have to take my word for it; the word count data is available for you to explore and draw insights from. Just input the words you’d like to count in the five white boxes (use space to clear out a cell), and see it reflected in the graph.
Unfortunately, this link has expired and I don’t have time to recover it.
Hope you enjoy discovering new trends with the tool! If you find an interesting pattern, please don’t hesitate to share it in the comments!
Thanks for reading! If you enjoyed reading, I’d appreciate it if you shared this with your friends or comment below. Data and computation inquiries can be made through the contact form or the comments.
aliases:
  - 2014/08/sona-words-july-2014.html
  - content/blog/2014-08-13-sona-words-july-2014/sona-words-july-2014.html
  - posts/2014-08-13-sona-words-july-2014
  - articles/sona-words-july-2014
On Pork and Plunder: The numbers behind the Priority Development Assistance Fund (PDAF) scam

For the first time in Philippine history, three Senators have been arrested without bail on charges of plunder. In this photo are the three Senators in question after Sen. Revilla delivered his privilege speech last June 2014.(Photo: Alex Nuevaespaña/Senate PRIB)
On charges of plunder related to the PDAF or pork barrel scam, three senators - Enrile, Estrada, and Revilla - were arrested in separate occasions during the past week, joining the alleged pork barrel mastermind Janet Lim-Napoles in incarceration. The trial will surely play out in a methodical, if not slow, pace, and many Filipinos will be in want of the case’s speedy resolution. What we can do right now, is to take PDAF releases data from the Department of Budget and Management and use it to take a look at the numbers behind the PDAF scam - how much did they release, to whom, and for what? These are questions we can answer with the data.
On Latin Honors: How hard is it to get to the top?

NOT LIKE THE OLD DAYS - Latin honors may not be as exclusive an award as it was before. (Photo: gadgetdude/Flickr, CC BY 2.0)
I was reading this article on how Latin honors have become increasingly common among graduates in recent history, and it contained interesting comparative data on various universities in Manila.
On the S&P Credit Rating Upgrade: The Numbers Behind BBB
Ratings agency Standard & Poor’s (S&P) has raised the Philippines sovereign credit rating from BBB- to BBB, making it fully in the ranks of investment-grade sovereign debt. Let’s look through those three B’s and look at the data behind their decision.

CREDIT UPGRADE - Credit rating’s, despite focusing on government-issued debt, include a variety of factors, such as political and economic risks, and are thus used to gauge the overall creditworthiness and economic outlook of a country’s economy. In this photos is Makati City, the central business district of the country. (Photo: chattygd/Flickr, CC BY 2.0)
The Philippines has received yet another credit rating upgrade, from BBB- to BBB, nudging it further into investment-grade territory. What do these letters really mean, though? We can take a look at the data that S&P has provided in support of their decision in this main and supplementary article, to find out more.
Before we look at the data, let’s define sovereign credit ratings. These ratings are regularly provided by ratings agencies (that largest of which are S&P, Fitch, and Moody’s) on sovereign debt or government issued debt, as a measure of the ability of a certain government to repay debt. Because governments ability to pay is dependent on various risks - political risks can cause policy changes, economic risks can cause changes in tax revenue - these ratings are also used to assess the general economic environment in a country.
The numbers that we will look at are all based on S&P reports. Take note that the figures for 2013 are expected figures, and those for 2014 onwards are forecasts developed by S&P.
Economic and Financial Indicators: Full Steam Ahead!
The first category of indicators that S&P uses in its assessment are economic and financial indicators that relate primarily to the internal economy and how it is able to generate and continue generating income and tax revenues.

GDP growth (upper-left) has been at a very impressive 4%-7% after the impact of the US financial crisis faded in 2009, and is expected to stay within 6% up to 2016. GDP per capita growth, which discounts the effect of population growth, is steady, implying that economic growth will continue to keep pace with the population. The same is true for number of employees. The fact that GDP per capita growth is expected to be higher than GDP per employee growth is because of the expanding labor force or demographic transition.
Investment and external demand (exports) (lower-left) have been the key drivers of growth for the Philippines, especially in 2010 when investors fled from the troubled US and Europe markets and into emerging markets. Domestic demand has little impact on economic growth.
Good news! Unemployment and inflation (upper-right) have both been on a downward trend - a very rare and exciting economic phenomenon. This suggests an increase in real wages, so that more people can feel the impact of increased economic growth.
Savings rates (lower-right) are not that impressive, hovering at around 25% and expected to fall further up to 2016. This is mitigated by the fact that more of these loanable funds will be used in productive investment, keeping the level of investment constant in relation to output.
S&P cites the public-private partnership program as one of the factors for boosting infrastructure projects, but identifies low GDP per capita levels and slow employment growth as key rating constraints.
External and Debt Indicators: Paying down the debt
The second category of indicators concerns the economy’s interaction with the world at large - foreign investment, foreign debt, and capital flows between the Philippines and the rest of the world.
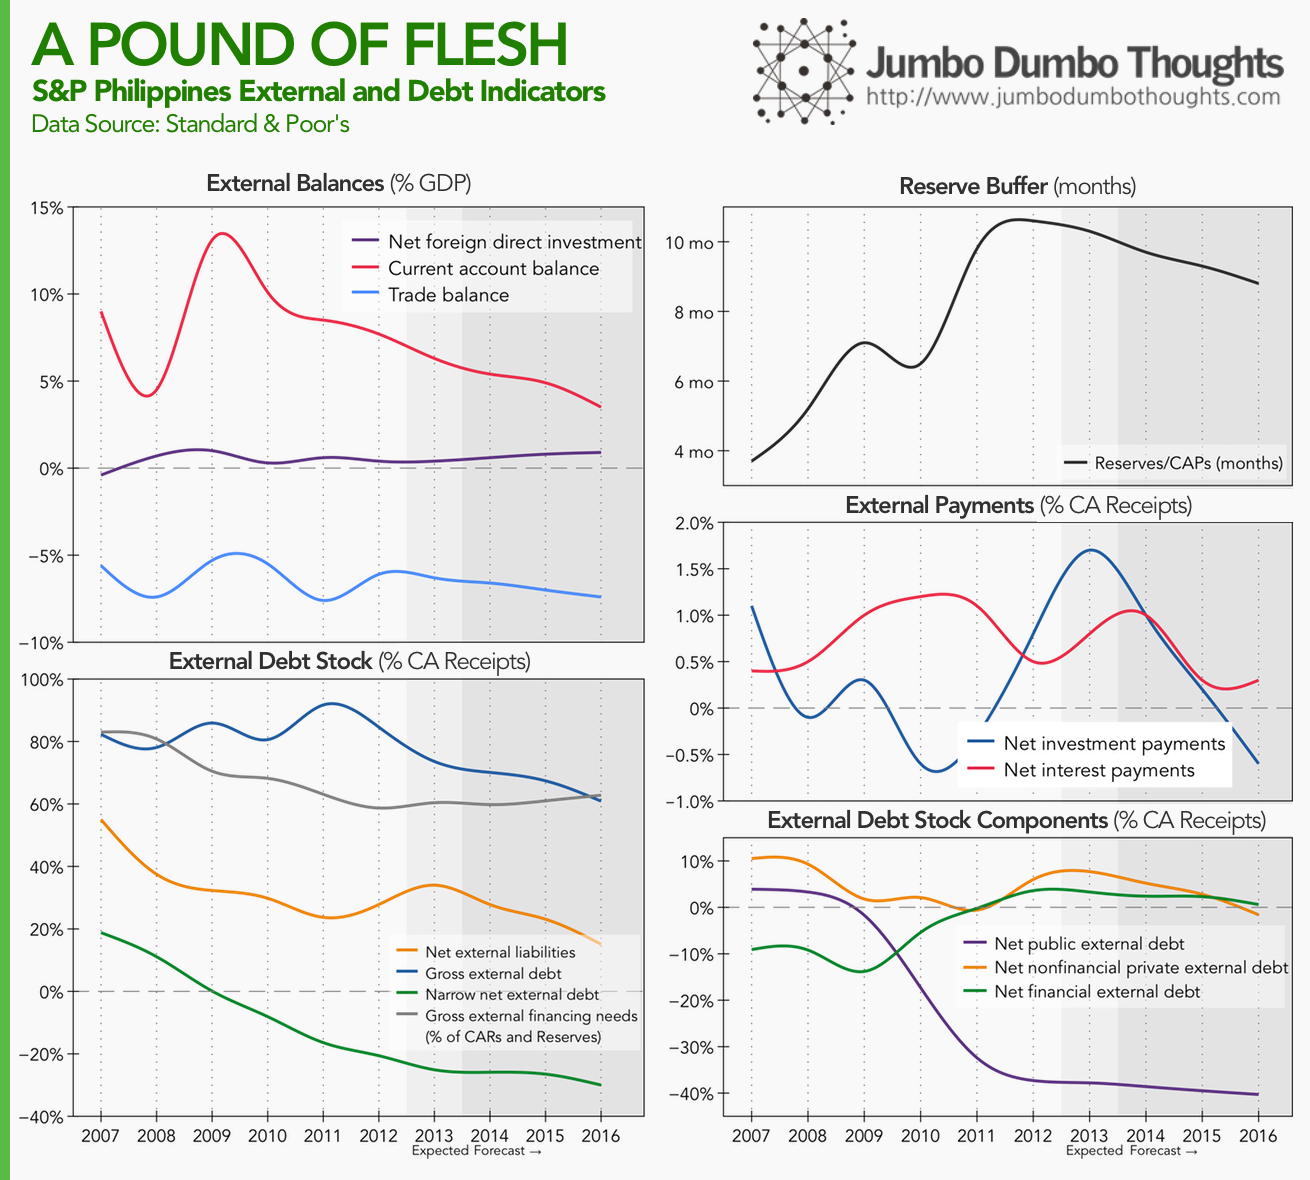
The Philippines' economic performance has caused an improvement in its debt standing. In terms of external balances, current account (upper-left) has stayed at a surplus, meaning that the country is a net lender to the rest of the world. This is because of large OFW remittances, evidenced by the large variance between foreign investment and the current account surplus. The current account surplus is expected to diminish in the future.
In terms of external debt stock (lower-left), all broad and narrow measures of debt are falling. Furthermore, narrow net external debt at a negative level means that we are less vulnerable to shocks if investors decide to pull their funds out of the country since it’s now a net external lender. However, gross external financing needs are still high at 60% to 80%, probably because of reliance on OFW remittances, and more recently the BPO sector. S&P doesn’t expect these inflows to stop anytime soon, however.
The reserve buffer (upper-right) is high; the country can last 9 to 10 months if funds continuously flow out of the country, without any receipts. In 2015, we can expect to be a foreign investor country ourselves, with net investment payments (middle-right) below zero. Net interest payments are also expected to fall.
If we look at who is contributing to the decrease in the country’s debt (lower-right), it’s amazingly the government (public external debt) that’s getting its foreign debt standing together and thus releasing loanable funds for investment in the private sector.
Fiscal Indicators: Prudent Government
The third category of indicators exhibited by S&P relates to fiscal standing, or how well the government is handling its finances (from a strictly inflow-outflow perspective, where those funds come from, and go, is a different question entirely).
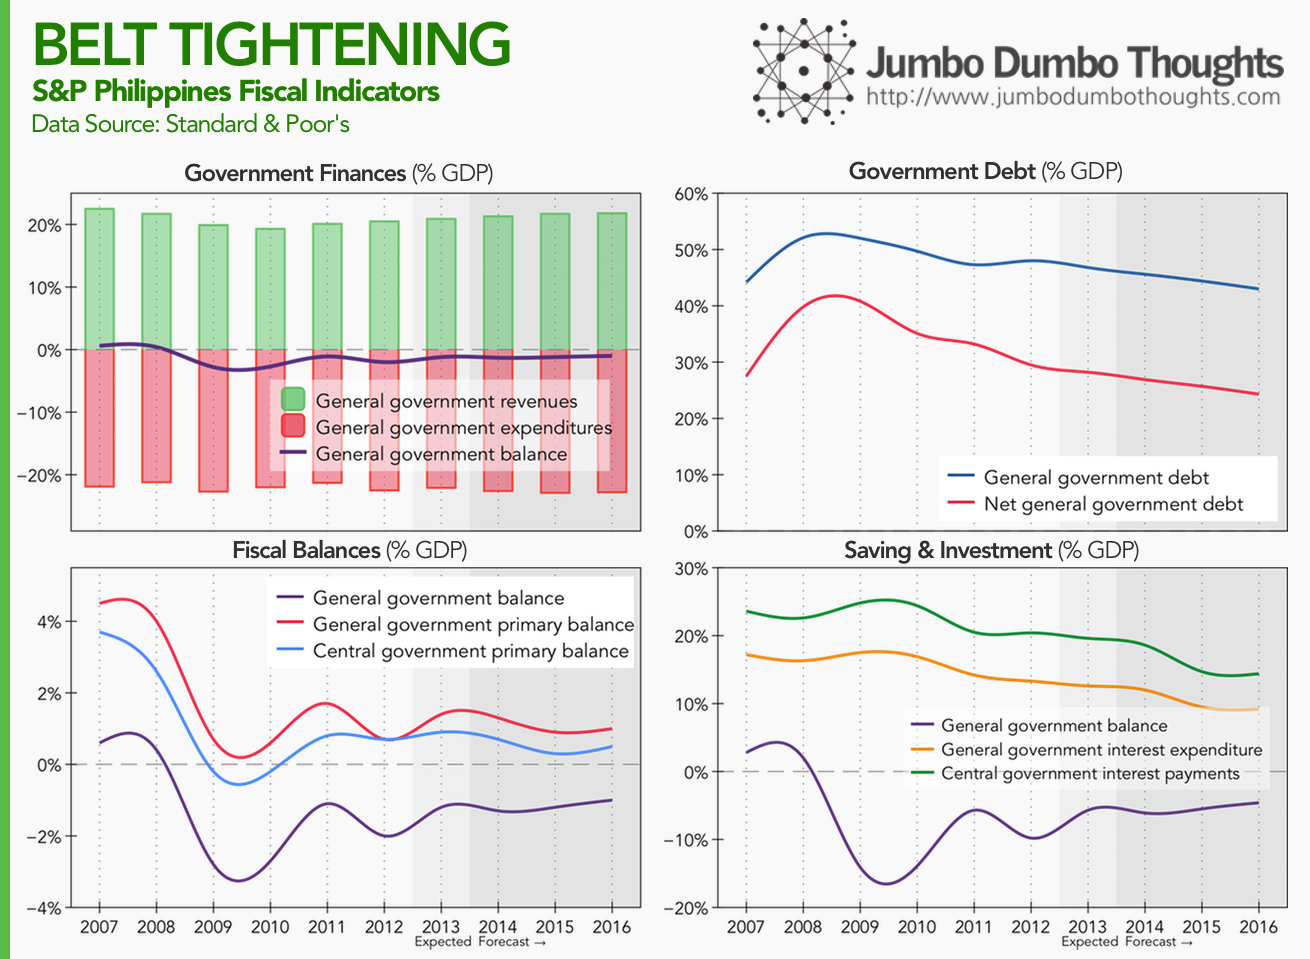
Government has been able to stay at a slight deficit (upper-left), managing its revenues and expenditures quite well. Furthermore, if we remove the impact of interest payments on preexisting government debt (the resulting measure is known as the government primary balance), the figures (lower-left) for both general government (which includes LGUs and GOCCs) and central government are on the positive, meaning that government can support its operations with current receipts and continue paying down debt and subsequently incurring lower interest expense, which is seen in the upper-right panel and the lower-right panel, respectively. However, S&P cites lack of infrastructure and efficient government programs as constraints.
Other Considerations
S&P also assesses monetary policy by the central bank, cites low domestic debt levels, well-anchored and credible monetary policy, and low inflation, as risk-reducing factors, but also notes that high-risk lending to a potentially overheating property sector and underdeveloped capital markets that limit monetary policy transmission as risks.
That’s the data behind the BBB rating. Hopefully, you can now see where specifically the Philippines has improved, has faltered, and has jogged in place. Hope you enjoyed reading!
Thanks for reading! If you found this post interesting, I’d really appreciate a share on your social networks or a comment with your thoughts. Data is taken from the S&P supplementary article.
aliases:
  - 2014/06/on-sp-credit-rating-upgrade.html
  - content/blog/2014-06-01-on-sp-credit-rating-upgrade/on-sp-credit-rating-upgrade.html
  - posts/2014-06-01-on-sp-credit-rating-upgrade
  - articles/on-sp-credit-rating-upgrade
On the Overweight and Obese: 1 in 4 Filipino adults are overweight, 1 in 20 are obese
From roughly 16%, 25% of the Filipino population is now overweight. (Photo: Thomas Kohler/Flickr, CC BY-SA 2.0)
A report by the Institute for Health Metrics and Evaluation reveals that obesity for both children and adults is on the rise in the Philippines. While girls are less prone to obesity than boys early on, this trend reverses as they become adults. However, both sexes are still losers in the battle of the bulge, as obesity rates increase as they age.
Filipinos love to eat, and the latest report from the Institute for Health Metrics and Evaluation (IHME) show that it might be negatively impacting obesity and overweight rates.
First, let’s take a look at obesity and overweight rates for both children and adults over time:
From 16% (1 in 6) in 1980, Roughly 25% (1 in 4) Filipino adults are overweight. The obesity rate has also increased from 3% to 5% in the past 30 years. For children, the overweight rate has nearly doubled from 2.7% (1 in 40) to 5.5% (1 in 20). Obesity rates have also been on the rise.
Next, let’s divide up the population by gender to see the differences between males and females:
There is a peculiar trend going on between the sexes. Overweight and obesity rates for female adults are higher than for male adults, but the opposite is true for children. Is this the effect of pregnancy in adulthood?
Lastly, we cut the population into age groups, and see how that’s evolved over time:
Obesity and overweight rates peak in around your 50’s, and are lowest in the late teens. Funnily enough, this seems to correlate with income over a person’s lifetime. The wallet grows and shrinks with the belly, doesn’t it?
There you go: a quick data primer on Filipino obesity and overweight rates. I think I’ll have to take a rain check on that buffet dinner.
Thanks for reading! If you found this post interesting, I’d appreciate it if you shared it on your social networks, or shared your thoughts in the comments. Data can be gathered from the IHME website.